It was a dark and stormy afternoon in late April. Suddenly, my phone
blared with a weather alert:
Potential for high winds exceeding 70 mph.
Only moments later, the alert made true on its promise: winds howled, trees shook, rain slammed against the windows.
Then, the power went out. I held my breath and hoped: ‘Come back. Come back. Pleeease come back.’ After a long pause... it didn’t. Instead, all the uninterruptible power supplies in our house started bleeping in unison. Our power was definitely out – and it stayed out. For three full days.
We lost the works during those three days: water1, heat, lights, refrigeration. By the time power was restored, all the food in the fridge and freezer was toast. You can imagine how it pained me to have to compost our homemade cherry pie filling and blackberry sauce.
But beyond the immediate inconvenience and discomfort of the outage, I began to wonder: How often are outages happening? Are long outages the new normal, or was this a fluke? How prepared are we?
I knew what I needed to do – dig into some data. I had casually collected 8+ years of outage history in my daily dashboard2. From it, I extracted what I needed and coupled it with some historical, local weather data. I wrote code, created plots, and soon patterns and insights started to emerge. For more details on the code, etc., dig into the Appendix.
If you’ve ever experienced a lengthy outage, or if you’ve ever thought about how to respond to a weather-related emergency, read on. You’ll get a tour of what I learned. And you’ll see how those learnings have shaped the way my wife and I are preparing for the next outage. Because there will be a next one.
When Is the Power Coming Back On?
Whenever the power goes out, you immediately want to know, ‘When will it be coming back on?’ Our power company typically supplies an estimate at the time we first report an outage. But these estimates often fluctuate as the outage progresses and more becomes known.
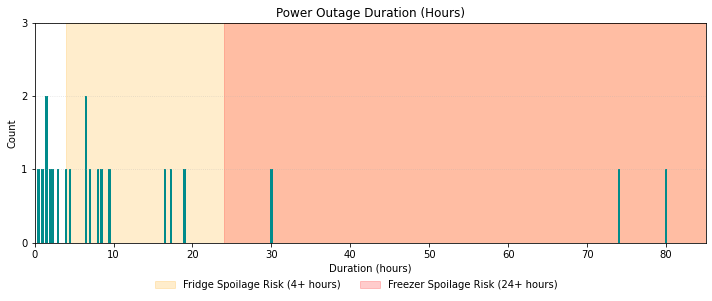
I wanted to find out, ‘How long do our outages actually last?’ Using the data I had collected myself over the last 8+ years, I produced Figure 1.

Across our 21 outages:
8 (38%) lasted for less than four hours – after which time food in a fridge may go bad.
15 (71%) lasted for less than half a day.
18 (86%) lasted for less than a full day.
Only 3 (14%) lasted for more than a day – which is when food in a freezer can become suspect.
For more details on food spoilage times, see these USDA and CDC resources.
The big insight for me: If we can power our primary needs for 12-24 hours, we will handle around 70-90% of our outages. If you’re like me, you tend to best remember the situations that were the worst – like the three–day outages. Learning that the strong majority of our outages are less than half a day gave me an entirely new perspective.
What Time of Day Do Outages Strike?
Based on my memories of past outages, my sense was, ‘We always seem to lose power at the worst possible times – while I’m asleep.’ To find out if my recollections were accurate, I plotted our outage start times, as shown in Figure 2.
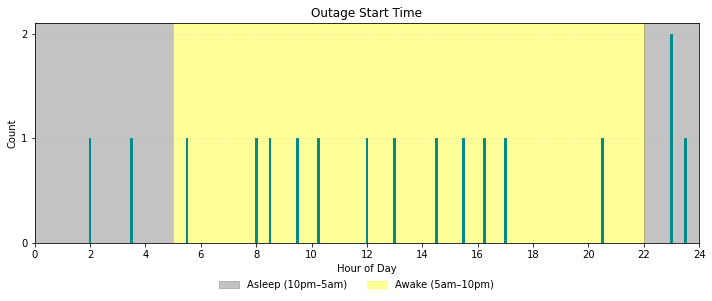
The outage start times appear to be sprinkled more or less randomly throughout the day. About a third of the outages3 (5 of 17, 30%) occurred between 10:00 pm and 5:00 am – which turns out to be 30% of the day.
Since we’re awake for 70% of the day, it looks likely we’ll able to act quickly when an outage strikes.
Which Months are Most Outage-Prone?
Our most recent outage happened at the end of April, 2025, and I was curious: ‘Do our outages occur more often during particular months (or seasons) of the year?’
As you might expect, the most memorable events for me were the ones that happened when it was either butt-clenchingly cold or ungodly hot. Figure 3 provides a view into the seasonal aspect of our outages.
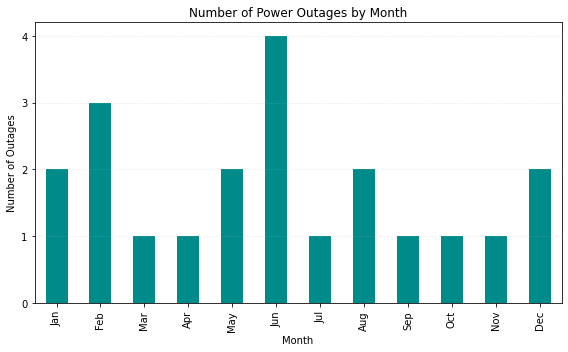
You can see that:
June and February lead the pack with 4 and 3 outages, resp.
The rest of the year, outages have been relatively evenly distributed, with one or two per month. No month has been outage-free.
My eyes spotted a winter cluster (Dec–Jan–Feb) and a summer cluster (May–Jun–Jul–Aug), each having above–average outage rates. But the dataset is very small, so the patterns I spotted may just be random variation.
Nevertheless, these findings suggest the need for year-round readiness. And I’ll keep collecting data to better understand the winter and summer storm seasons.
What’s the Trend?
You can probably guess the next questions on my mind:
‘Are we without power for longer periods and are the outages more frequent than in the past?’
Figure 4 presents the trends over time. The top half, part (a), displays the increasing number of hours that we have been without power since I started collecting data at the end of 2016. The bottom half, part (b), counts the number of outages each year during that same period.
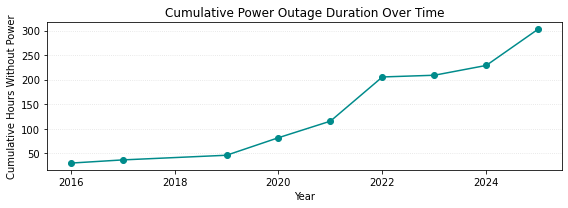
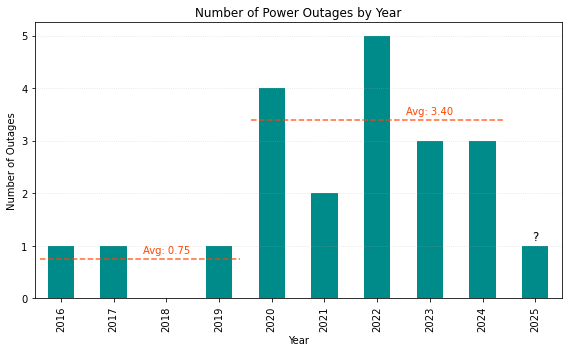
You can see what appears to be a dramatic change in the slope of the line before 2020 versus after 2020. We have spent more time each year without power than we did five years ago. Similarly, the average number of outages jumps from less than 1 per year prior to 2020 to more than 3 per year since then4. Digging into the data table (not shown), I found that our two longest outages, 74 hours and 80 hours, occurred in 2025 and 2022, respectively – that is, during the post–2020 period.
It’s tempting to infer that there is a trend, and that something significant changed around 2020. But again, keep in mind that this is an extremely small sample. The number and timing of these rare outage events may simply be coincidence. Coincidence or not, I still think it makes sense for us to prepare more and better than we have in the past.
But Why is the Power Out?
I feel like a little kid when I whine, ‘But whyyyyy is the power out?’
Actually, it’s not a big mystery. The vast majority of power lines in our area stand above ground. When they go down, so does our power. I suspected that wind, sometimes coupled with heavy snow or ice, has been the main culprit whenever we have lost power.
To study this aspect further, I found and downloaded daily weather summary data5 for Washington County, PA, where I live. The data included high-wind-speed info which I sorted in descending order, as shown in Figure 5. Then I simply highlighted the days we had lost power.
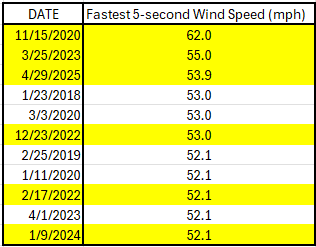
The top three days all coincided with power outages! Looking further down the list, I found that 6 of the top 11 days (more than half) were days we lost power. On all of these days, the top wind speed exceeded 50 mph.
To me, the takeaway seemed crystal clear: if winds reach these speeds, a power outage becomes very likely – nearly a 50/50 prospect. Practically, I think it means we need to batten down the hatches and prepare for an outage whenever the forecasters issue a high wind-speed advisory or a severe thunderstorm warning.
What Did We Learn and What’s Next?
Looking back across 8+ years and 21 power outages, we found that:
Nearly all (18) have been less than 24 hours, many (15) less than 12 hours, and some (8) even less than 4 hours.
Most of our outages (70%) occur while we’re awake (5am-10pm), when we’re better able to act and react.
Our outages can happen any time of year, but winter and summer storm seasons may deserve extra attention.
There may be a trend towards longer and more frequent outages, but more data is needed to confirm or deny that notion.
High winds are strongly associated with our outages. When a weather advisory calls for strong gusts, it’s time to prep.
Do any of these findings resonate with your own power outage experiences? Please drop me a note. I’d love to hear how similar – or different – your electricity-free adventures have been.
Do you live in an outage-prone area? Then consider collecting your own data. And if you’re already doing a project like this, please write and tell me about it. I want to find out what you’re working on and learn how you’re addressing the challenges.
Discovering these patterns has changed how my wife and I think about readiness. Now we know:
when an outage is likely to occur
what we need to do to prepare before an outage happens
how to manage ourselves and our resources during an outage
In my next article, I’ll share our plan – including the apps, the gear, the checklist, etc. – and illustrate how we implement it. I’ll also describe the reasons why behind the things we decided *not* to do: like not powering the whole house nor the well pump.
Appendix: The Data & Code Behind the Story
I built this study of our power outages from:
My own log of 21 interruptions (2016–2025)
NOAA/NCEI daily wind speed data for Washington County, PA
A handful of Python scripts that pull the data together and produce the plots shown in the previous sections
If you’re curious, or you want to do something similar for your own home or business, check out the GitHub repo for this article. There you’ll find the data, the code, and my finished plots that you can use for reference.
We get our water from a well. When the power goes out, the well pump can’t pump. ↩︎
My dashboard is an Excel workbook that is part journal, part to-do list. ↩︎
Unfortunately, I failed to record the start times for 4 of the outages. That’s why the bars in the plot total only to 17, rather than full 21. I promise to do better in the future. ↩︎
The data for 2025 is only partial at the time I’m writing this. That’s why I don’t include it in the average. ↩︎
To get yours, go to NOAA Climate Data Online, choose
Daily Summaries, search for your county, and make a request. I got my data in less than an hour. ↩︎