Last updated: Oct. 10, 2026
What I’m working on
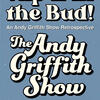
- Doing my first-ever podcast with my friend, Paul. It’s called “Nip It in the Bud! An Andy Griffith Show Retrospective”. We’re having a blast. You can find it on Spotify, Apple, and other outlets. Our next episode will be “Andy the Matchmaker”.
What I Just Shipped
Updated all the weekly reports - Posted Oct. 10, 2026
The latest episode of our Nip It in the Bud podcast, Irresistible Andy, went live. - Posted Oct 6, 2026
Added a new collection of Weather Reports - Posted August 9, 2026
Created a handful of new charts for the Weekly Radon Reports - Posted August 1, 2026
Added a new Reports section to the website - Posted July 5, 2026
Four Questions Our Solar Charts Help Us Answer - Posted May 7, 2026
4 Years, 100 MWh of Solar Power… in Pittsburgh? - Posted April 13, 2026
How Fast Does a House Get Cold When the Power Goes Out - Posted April 2, 2026
Why Bother with Notes? My Web of Notes Manifesto - Posted February 27, 2026
Ever Wonder What Your (Digital) Mind Looks Like? - Posted February 5, 2026
The Weather-Radon Connection: Surprisingly Simple Rules - Posted January 28, 2026
Open Questions I’m Exploring
- We’ve all seen what a thunderstorm looks like in real life. I’d like to see what one looks like through data visualizations: air temperature, dew point, wind speed and direction, proximity of lightning, rain intensity, and more.