📄 Download a PDF version of this article
A Surprising Discovery
When my wife and I spec’d our solar panel system with our installer, we had a simple goal: a zero electric bill. To get there, our panels would need to generate enough electricity to supply our home for a year.
The panels were installed, and the electric bills started coming in. The amounts due were zero, and we were even running a credit – thanks to net metering1. All good, but I wanted to know more. Since inception, I captured our daily production in a spreadsheet, and I produced weekly reports. On the consumption side, though, it was tedious to manually enter the relevant numbers from our electric bill to track our usage. So I didn’t.
But with some help from Janet2, I automated the data extraction from our electric bill (see the Appendix for more). With that, I could visualize the combined production–consumption data. I discovered that not only were we covering our household energy needs, we were generating a surplus. I began to imagine that the surplus could power an electric vehicle (EV). The big question: Would the surplus be enough for us to drive an EV for free?
If you’re considering solar, or an EV, or just trying to understand your own energy usage, stay tuned. You might just find our story interesting.
An Out-of-Phase Picture
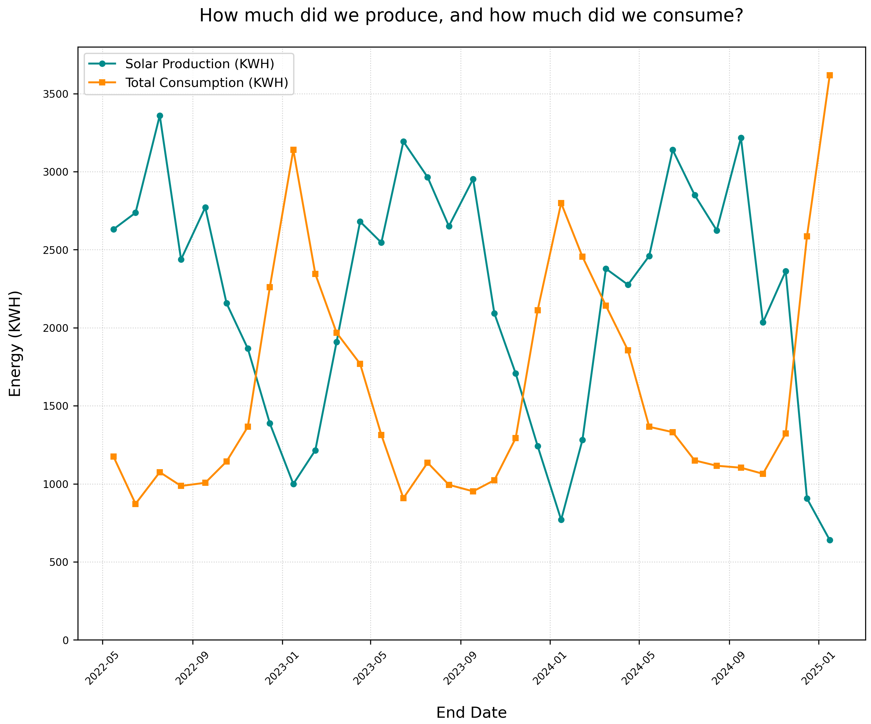
From my early production charts, I knew that our solar production fluctuated due to seasonal changes (longer days in summer, shorter days in winter), weather patterns, and even daily cloud cover. But I didn’t know how those ups and downs related to our consumption throughout the year.

To get a handle on that relationship, I created a two-line chart showing our production and consumption over time (Figure 1). This plot revealed that our production and consumption were ‘out-of-phase’: when we produced the most (Apr – Nov), we consumed the least, and on the flip side, when we produced the least (Dec – Feb), we consumed the most.
The Surplus Situation
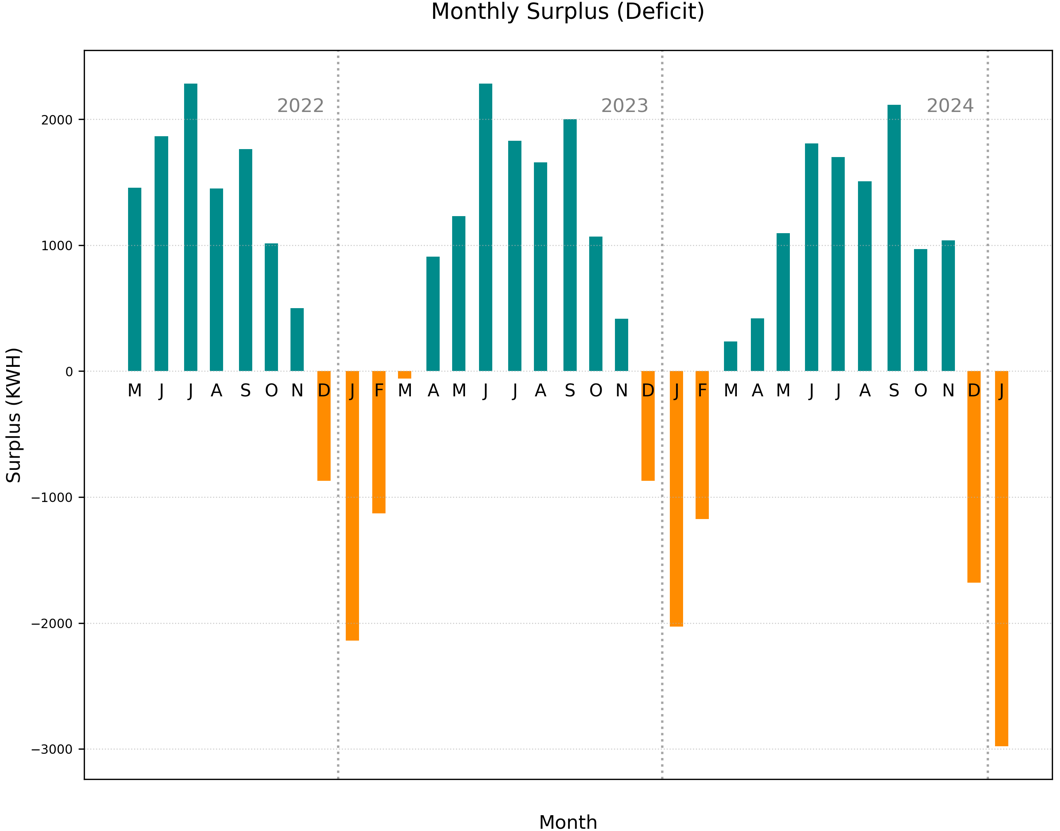
Seeing the out-of-phase cycle was helpful, but I wanted more clarity. I wanted to visualize the difference between production and consumption: call it a surplus when positive or a deficit when negative. In Figure 2, you can see the stark contrast between the periods of surplus and the periods of deficit.
Is This a Problem? Or an Opportunity?
At first, this seemed like a problem, a frustrating mismatch. We produced plenty of energy when we didn’t really need it, and not enough when we did.
The longer I thought about it, though, the more this problem seemed like an opportunity. If we were consistently overproducing for most of the year, there must be something we could do with that surplus. My mind boggled:
‘Could we power an electric vehicle? Could we drive for free?’
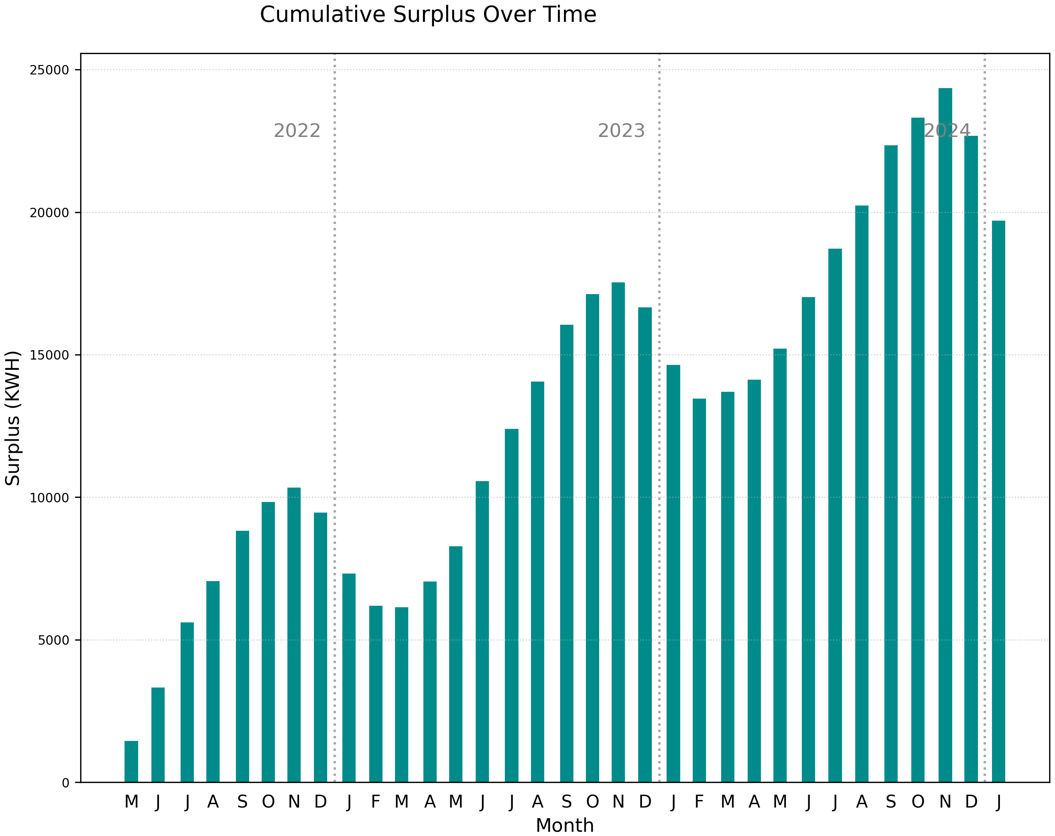
These possibilities inspired me to build a chart of the accumulating surplus over time, shown in Figure 3. As you can see, the surplus has been building since the panels first went live. The surplus grows steadily from April thru November, then it retreats during the winter months. But over the course of an entire year, the total surplus grows significantly.
Can We Drive an EV for Free?
The surplus situation looked promising, but to fully answer the EV question I wanted to run some simulations. By subtracting equal monthly amounts from the accumulating surplus, I could gauge the impact of regularly charging an EV at home. I found that we could budget 500 KWH each month for charging, still completely power our household, and keep the surplus above water (maintain a zero electric bill).
But would 500 KWH per month be enough to cover our driving needs? After a little research, I chose to work with a conversion rate of 35 KWH per 100 miles, corresponding to a modestly efficient EV. Based on that rate, 500 KWH of charging converts to 1,400 miles of driving.
Our driving averages 12K miles per year, or 1,000 miles each month. We have 1,400 miles (equivalent) of surplus solar production available for charging. Even with reduced EV battery performance in winter, variation in our production and consumption, slow degradation of the solar panels over time, etc., it looks like...
Yes! We can drive an EV for free!!
All we need to do is buy one ... and pay for service, maintenance, etc. But that’s another data-driven discussion for another day.
Final Thoughts
Through a mix of hands-on data analysis, automation, visualization, and a little simulation, we uncovered some insights – ones that weren’t immediately obvious from our monthly electric bills. In particular, we found that our solar panels produce a large enough surplus for us to also charge an EV – and drive for free!
For me, this whole process reinforced the value of collecting and analyzing my own, real-world data. If you do the same, for whatever purpose, you can take this to the bank: the numbers will tell you a story – even one you might not expect – if you make the effort to look for it.
How are you using personal data to drive some of your own decisions? Drop me a comment and let me know – I’d love to hear what you’re working on.
Appendix
The most useful technical skill I learned during this project was how to automate data extraction from my electric bills (PDF files). The tedious, error-prone, manual process of transcribing numbers from the them into a spreadsheet was something that I just was not willing to do regularly.
That’s where Python’s fitz/PyMuPDF library came in. Using it, I could write a script to ‘read’ the PDFs, pull out the relevant numbers, and insert them into a dataframe (spreadsheet), alongside the solar production values.
Now, I run my Python script once a month and produce some beautiful charts. They help my wife and me monitor the solar panels and keep an eye on our energy usage. They also keep us dreaming about the day, in the not-too-distant future, when we finally buy that electric vehicle.
Net metering is a utility billing practice where a homeowner’s excess solar production offsets energy drawn from the electric grid. ↩︎
Janet is the nickname I’ve given to ChatGPT. It’s an homage to a character in the show, The Good Place. ↩︎