Collab: Exploring Radon Levels with Data Analyst GPT
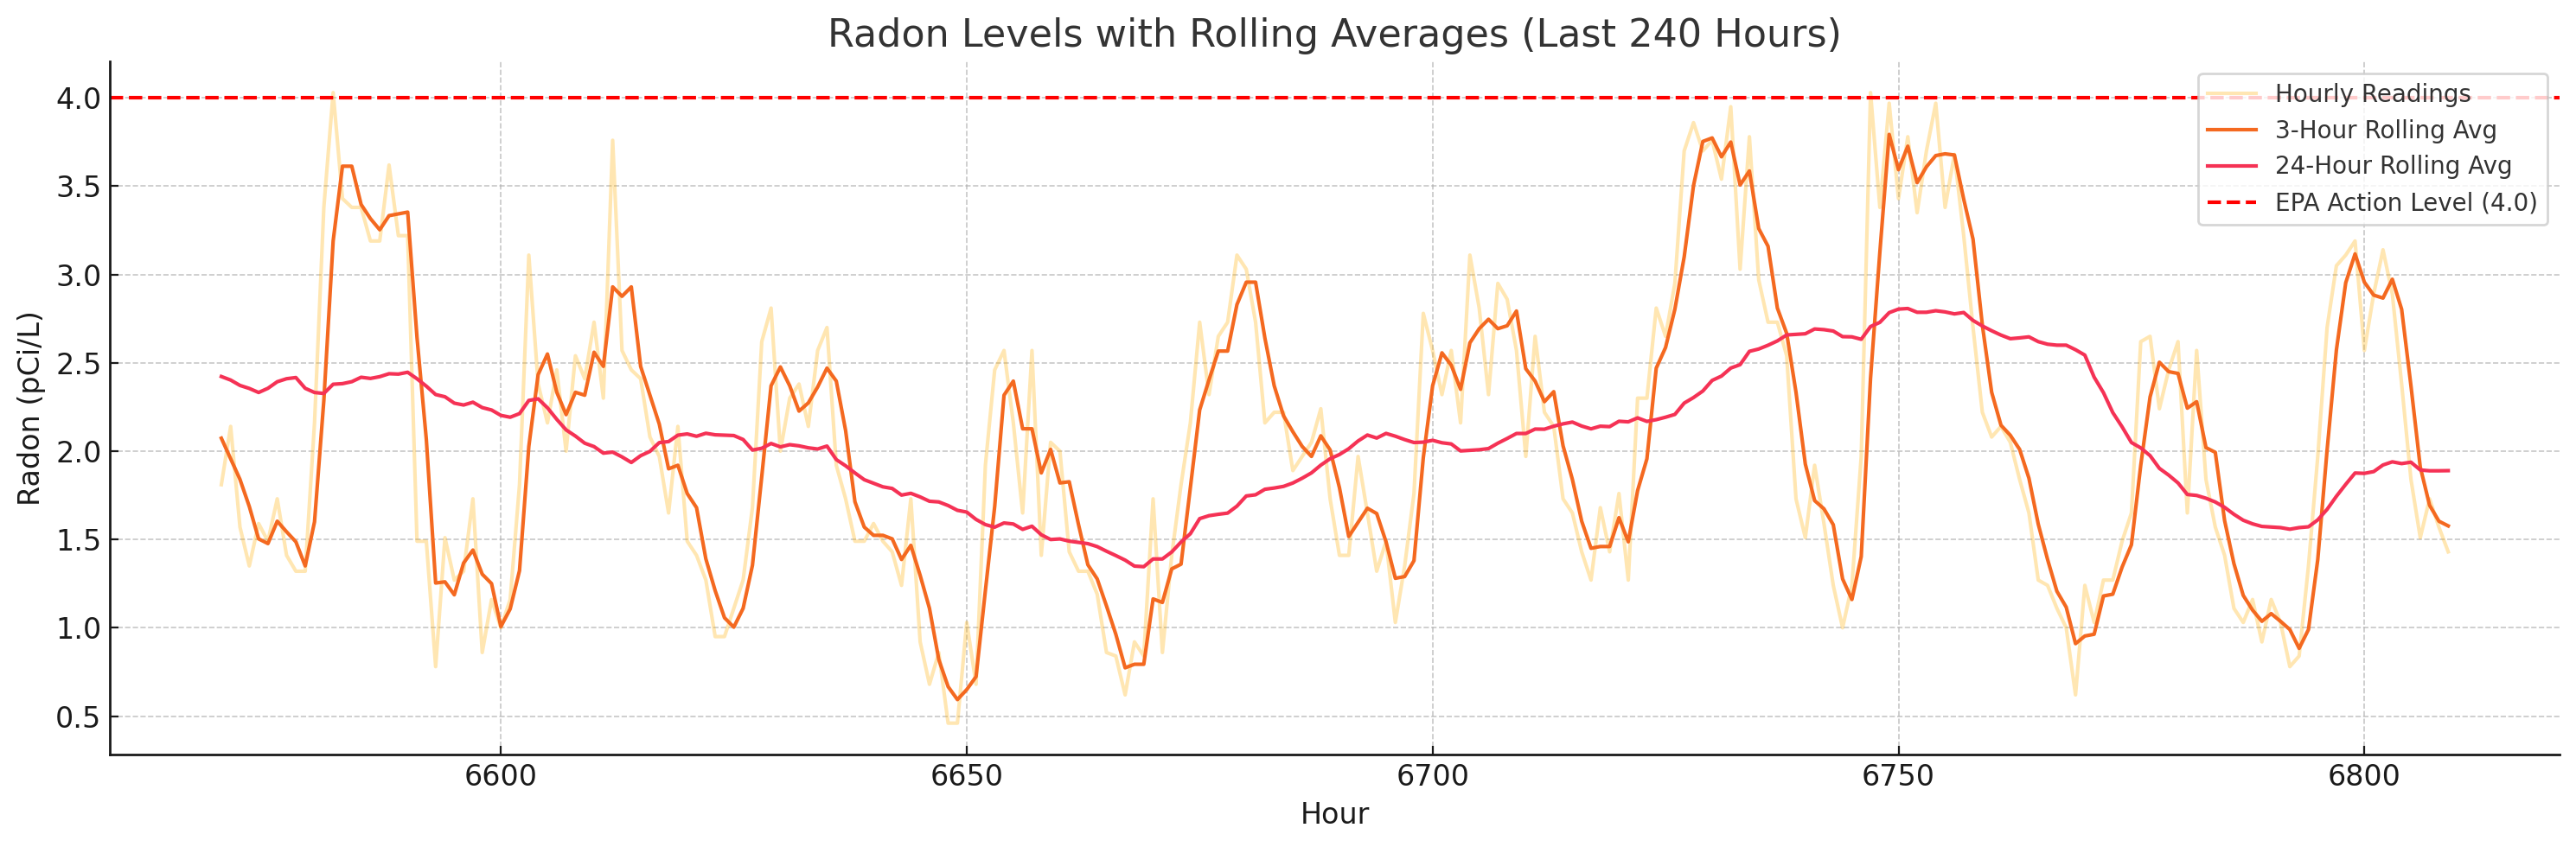
I’ve been tracking radon levels in our home for 9 months. Collaborating with Data Analyst GPT to analyze them was actually fun…
I’ve been tracking radon levels in our home for 9 months. Collaborating with Data Analyst GPT to analyze them was actually fun…
Suppose I told you that deep insights about your data can come from seeing what’s not there?…