How Fast Does a House Get Cold When the Power Goes Out?
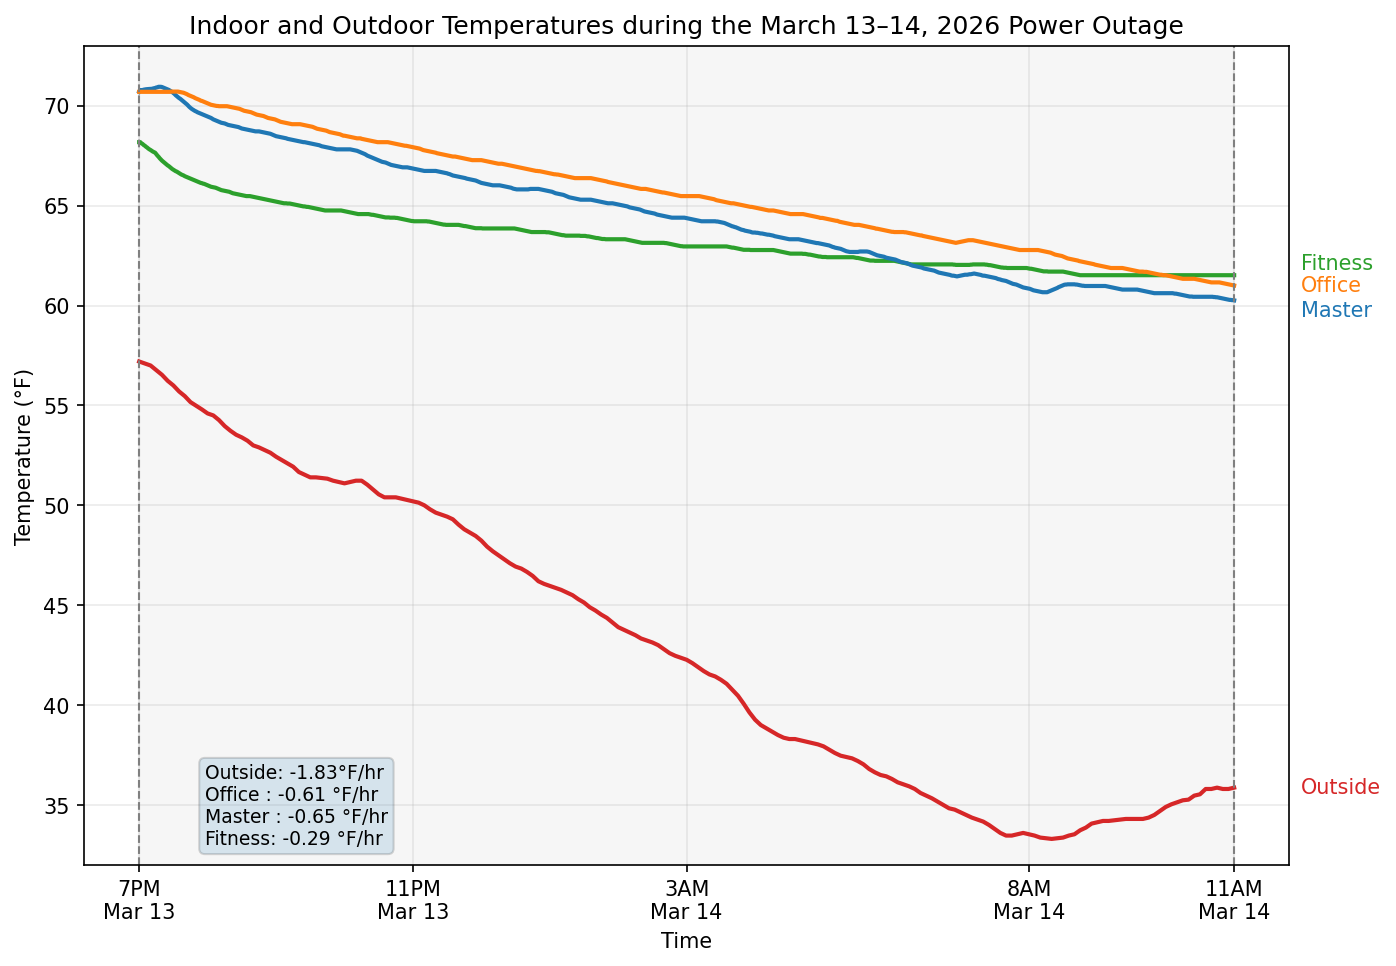
If you lose power in cold weather, you might double your stay-at-home time window by retreating to your basement. If you think an outage is likely, pre-heating can buy you a lot more time, too. See how I broke down our data from a recent outage.