Weekly Radon Reports
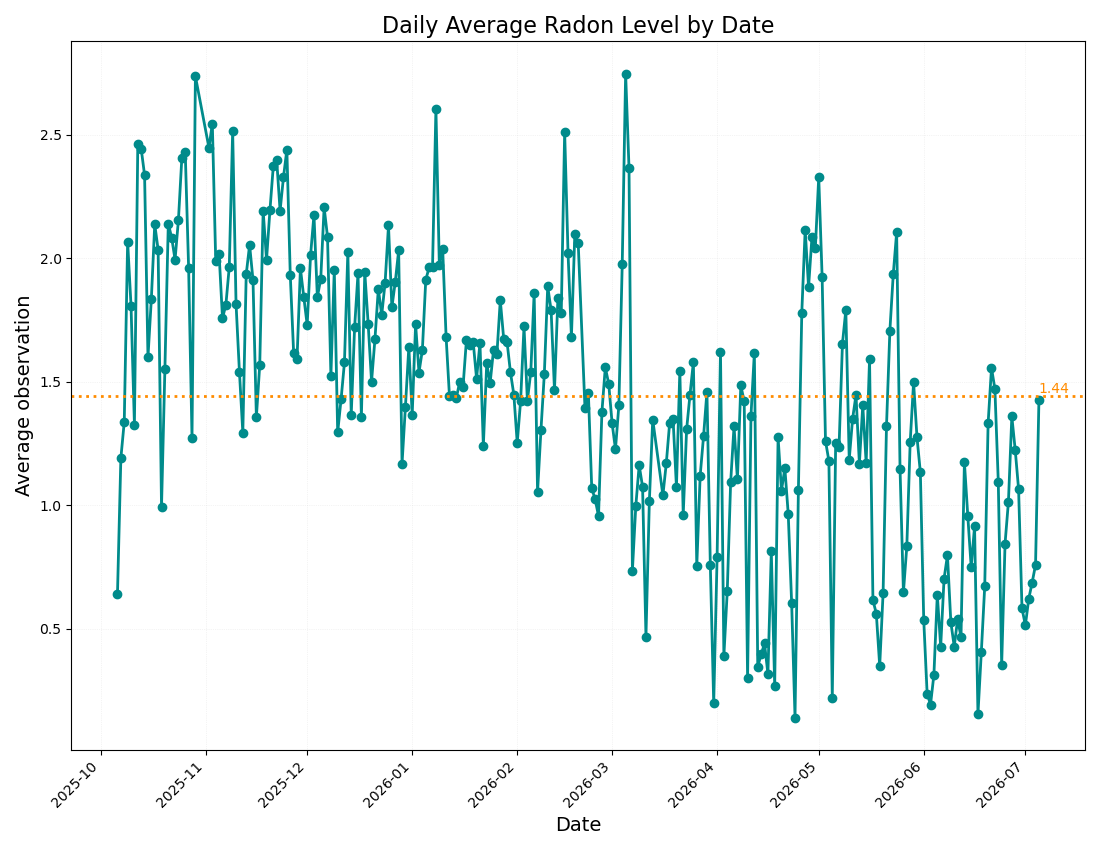
Charts of our household radon levels, including our daily average radon level over time and a histogram of our radon levels.
Charts of our household radon levels, including our daily average radon level over time and a histogram of our radon levels.
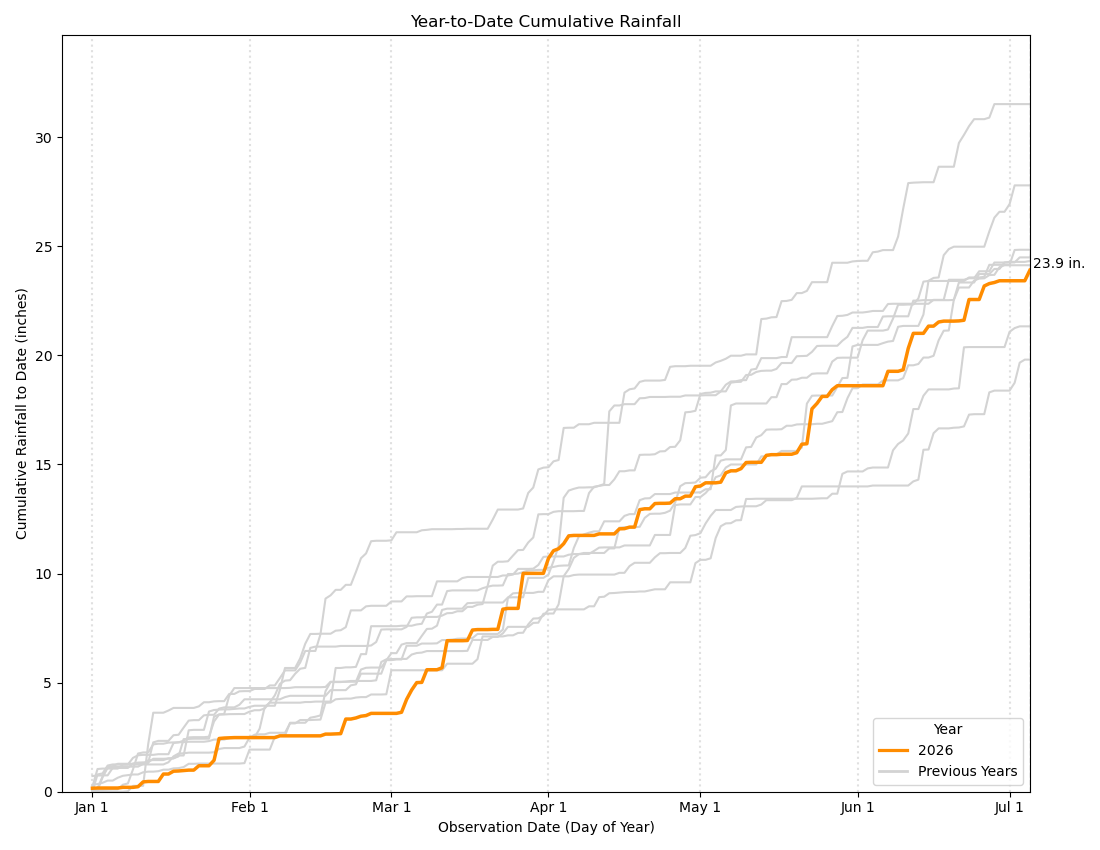
Charts of our local rainfall, including the following: year-to-date cumulative rainfall, monthly rainfall by year, weekly rainfall, and daily rainfall.
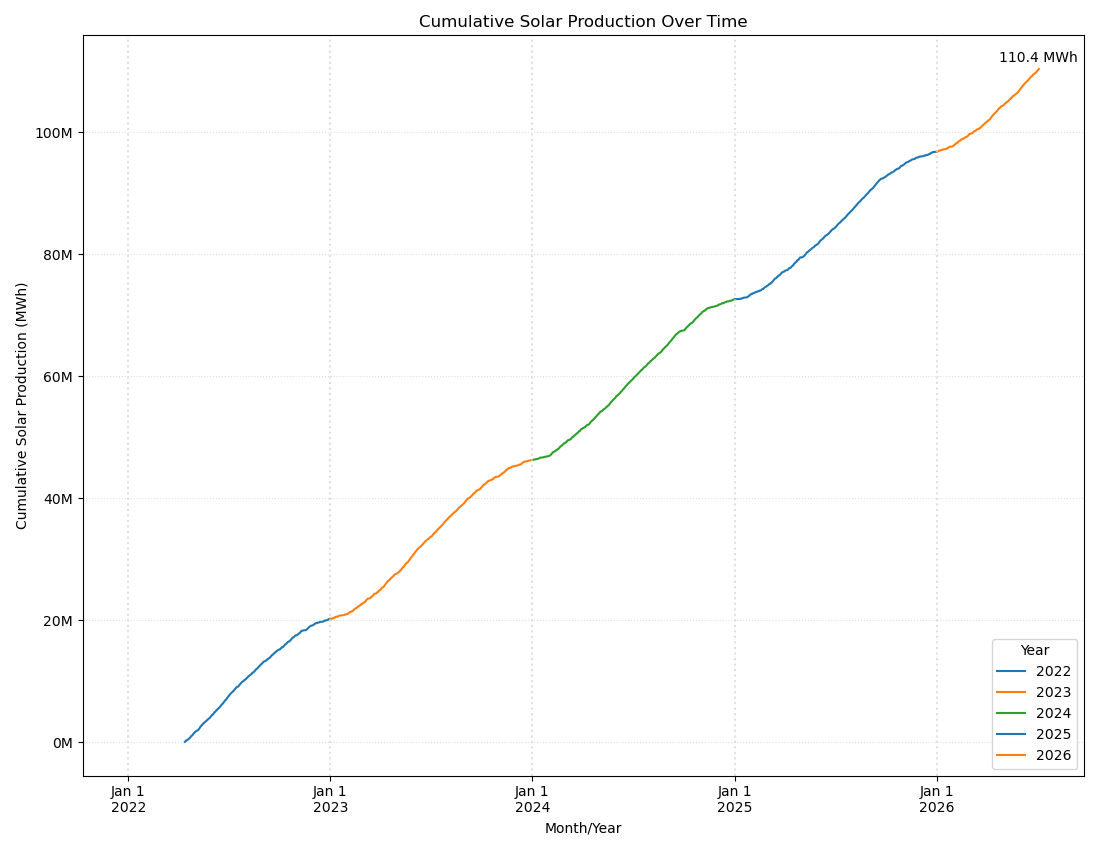
Charts of our solar panel production, including the following: our cumulative production over time, year-to-date production, monthly production by year, and daily production (recent months)