📄 Download a PDF version of this article
Suppose I told you that deep insights about your data can come from seeing what’s not there? Would you believe me?
I’ve seen it happen. Many times.
Missing values — those empty cells in your rows and columns — are easy to overlook. They are the poor stepchildren of a dataset. Data scientists routinely ignore, delete, or even impute (guesstimate) them into oblivion.
But those stepchildren might be Cinderellas in waiting. They might tell you surprising stories about hidden patterns that you’d miss otherwise.
Let me show you what I mean...
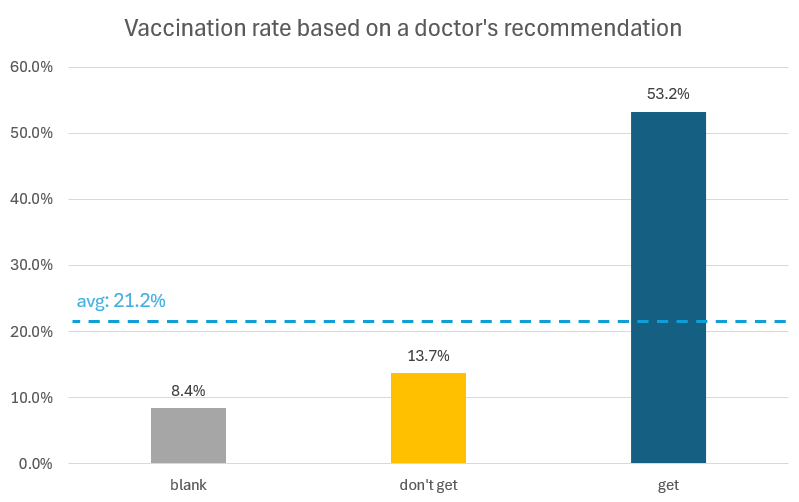
The CDC’s annual flu survey1 is a terrific example of how missing data can conceal crucial patterns of behavior. Figure 1 presents data from the survey.
Figure 1. H1N1 flu vaccination rates vary based on a doctor’s recommendation. The overall average rate, shown by the dotted line, is 21.2%.
You can see the different H1N1 vaccination (vax) rates when a doctor recommends that a patient:
get the vaccine (53.2% vax rate)
not get the vaccine (13.7% vax rate)
Blanks are the missing values2 (8.4% vax rate), and notice that I display them as a distinct category in the chart.
The missing values — those blanks — might seem unimportant at first glance. But I believe they tell a story that’s not only surprising, but also highly actionable. What do you think it is? Take a minute to digest the figure... I’ll wait... Don’t peek ahead.
Here’s my take.
I think the missing values represent a third, distinct category of patient–doctor interaction: No recommendation. In other words, the missing values mean that the doctor didn’t discuss vaccine options with the patient.
Why do I think this?
If the missing values represented a question accidentally skipped or not recorded by the surveyor, you would expect the missing values to occur more or less at random. As a result, you would expect the the missing value category to be an average blend of the other categories — with an average vax rate.
But the rate isn’t average.
It’s not even close!
You can see from the chart that it’s less than half the average vax rate. That’s not random. That’s a thing.
Not only is it much less than average, it’s less than the vax rate when the doctor recommends not to get the vaccine.
Can this be right? Does it even make sense? Sure it does. When a doctor makes any recommendation, the patient’s awareness goes up – by definition. Patients generally follow the recommendation, once made aware. But without that raised awareness (or any awareness), a patient typically does nothing.
Here’s the actionable part: if the CDC’s goal is to increase vax rates, they need to encourage – and train – more docs to make recommendations to their patients. Even a negative recommendation increases the vax rate compared to saying nothing.
As a data scientist, what lessons can you take away from all this3?
Do preserve the information in the missing values by treating them as a distinct category.
Don’t obliterate the information, say, by replacing the missing values with imputed values, or by deleting the records with the missing values.
Do ask yourself and your colleagues and other experts, “Why are these values missing?”
Don’t assume the values are just missing at random. Run the stats and see if the missing category outcomes are much different than the average.
On that last point: If the outcomes are average, then the values are probably missing due to something random. But, if the outcomes are significantly different than average, you’ve uncovered something unexpected.
Blindly applying a standard approach4 can cause you to completely miss the insights.
Instead, look closely to see and make sense of what’s not there. You’ll gain a deep understanding of your data — and the human stories behind it.
Source: CDC, NCRID and NCHS (2010), 2009 National Immunization Survey. Analyses, interpretations, or conclusions reached are those of the author and not NCHS, which is responsible only for the initial data. ↩︎
Over 2,000 doctor recommendations are missing in the full dataset of nearly 27,000 survey responses. ↩︎
Remember, these lessons apply across domains, not just to healthcare. Wherever data is collected, some of it will be missing. ↩︎
Like imputing-and-replacing the missing values, or worse, deleting the records with missing values. ↩︎