Radon, schmadon. I never thought about it — until a big rainstorm flooded our basement. During the cleanup, a good friend asked, “While you’re at it, have you ever checked your radon level?”
Two test kits later, we found our radon level in the EPA’s gray zone: “consider remediation”. We got remediation … and a continuous monitor.
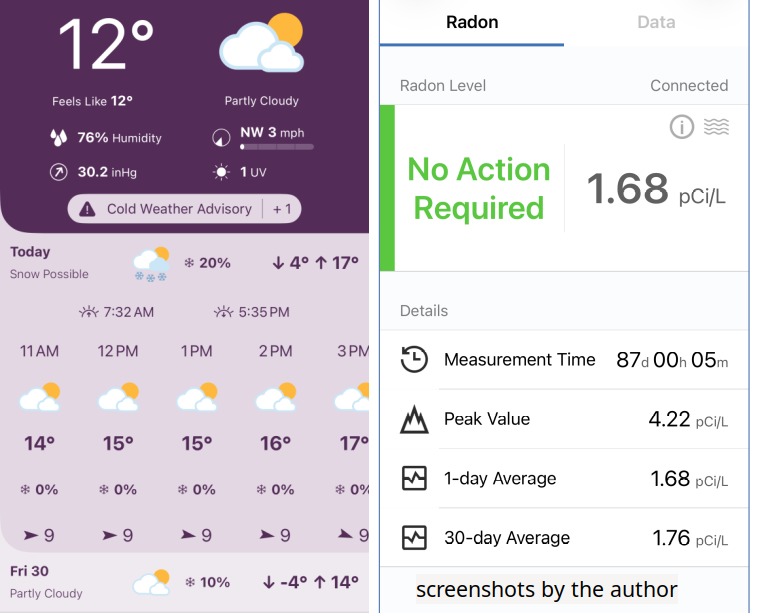
Now, I can’t stop thinking about radon. I’ve been collecting data and tracking it for 16 months (see my previous article). During that time, it seemed like our radon level changed with the weather conditions, but I didn’t have any solid weather data to back me up. Then, my wife got me a personal weather station for my birthday. Now I have data — and some surprisingly simple rules connecting the weather outside and the radon level inside.
Why It Matters
“Radon is the number one cause of lung cancer among non-smokers, according to EPA estimates. Overall, radon is the second leading cause of lung cancer. Radon is responsible for about 21,000 lung cancer deaths every year. About 2,900 of these deaths occur among people who have never smoked.” - Health Risk of Radon (epa.gov)
It’s a serious concern. It made me curious. If you’ve read this far, you’re curious, too.
(How) Does Weather Impact Radon Levels?
After syncing my radon and weather data, I built an interactive visualization tool to test my hunches. I started with time charts, added scatter plots, and overlaid “if-then” filters to explore the weather-radon connection. The best rules I found appear below.
Quick aside: For me, a rule is effective if:
- It predicts much better than baseline1.
- I can use it frequently.
I highlight these criteria for each rule below.
Rule: If dew point is low → radon is low
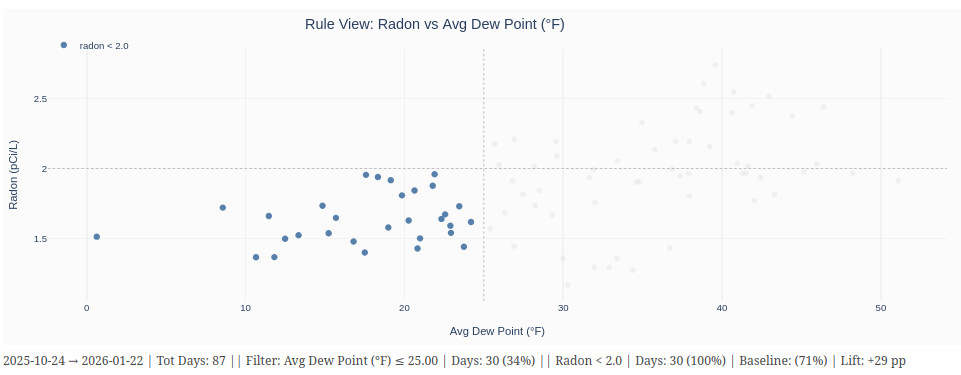
This scatter plot displays the (daily average) radon level versus the (daily average) dew point. Each dot is a different day. The text below the plot provides some useful stats.
First, notice the dotted horizontal line. I defined “low” to be a radon level of 2.0 pCi/L or below2. It’s the EPA’s “no action” level — that’s where you want to be.
Next, using my tool, I can move the dotted vertical line to set a cutoff value on the dew point.
Finally, I can filter the data to focus on the region above or below the cutoff. In this focus region, low-radon days are colored blue; otherwise, they’re colored orange. The tool grays out the days outside the focus region.
After some experimenting, I found a good cutoff for dew point to be 25 °F or less (left of the dotted vertical line). Notice that all points in the focus region are blue. That means they are all low-radon days.
In terms of my “good rule” criteria:
- This rule predicts low-radon days with 100% accuracy, much better than the baseline of 71%.
- This rule covers more than a third of the days in my sample. That’s useful.
Rule: If wind speed is high → radon is low
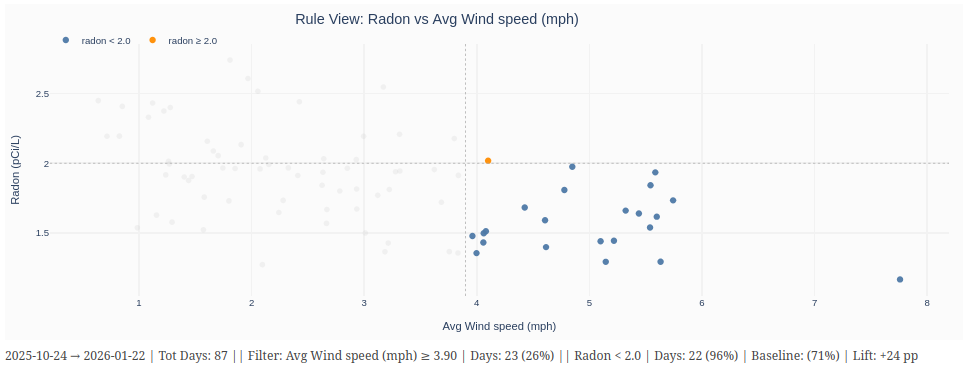
Here, I discovered a useful region for (daily average) wind speed to be 3.9 mph or above. You can see a single orange day/dot in the focus region, just barely above the radon threshold. This rule predicts with 96% accuracy, and it covers more than a one-fourth of the observations.
Rule: If pressure is low → radon is low
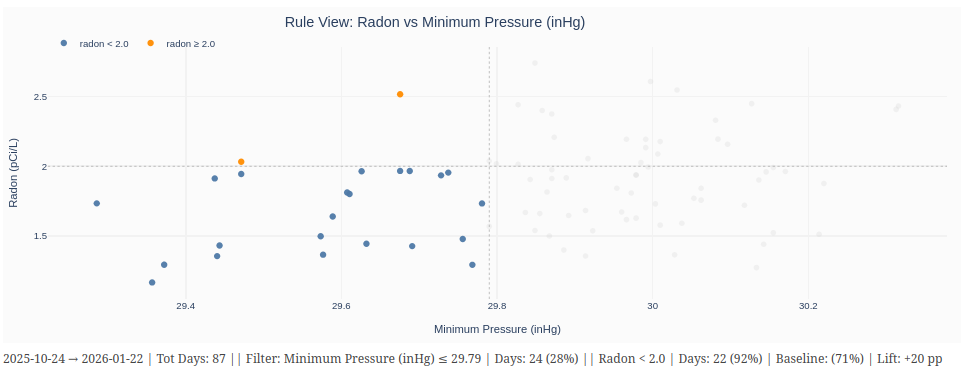
This plot displays the results for (minimum daily) barometric pressure. The rule region, 29.79 inHg or below, classifies days with 92% accuracy across more than one-fourth of the dataset.
Wrap-Up
The early signs are clear: weather affects radon.
Are the rules above written in stone? Absolutely not. The approach shows promise, but it’s early days. The observation period covers only 90 consecutive days, from October 2025 thru January 2026, for our home in western PA. I really need multiple years of radon and weather data that span all seasons.
So I’ll keep collecting data — and building more visuals and analysis. Stay tuned. I’m sure there are more surprises ahead. If you’re doing something similar, or just have questions, let me know. I’d love to hear from you.