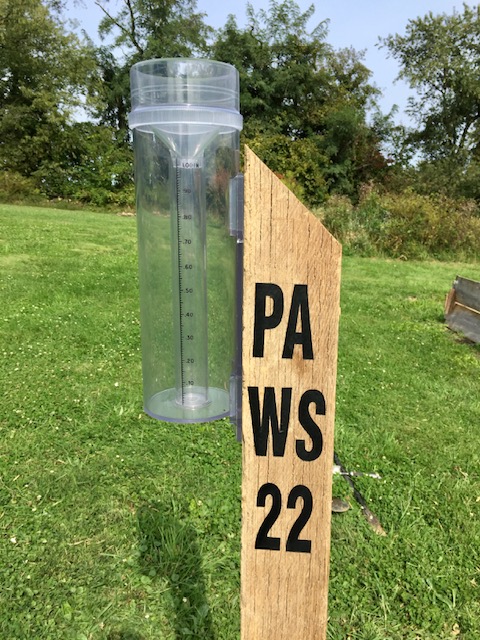
For the past 8 years, I’ve been tracking our rainfall with an official, CoCoRaHS-sanctioned rain gauge — that’s it in the cover image. (My station: PA-WS-22.)
The numbers add up fast when you add up the raindrops. You’ll see plenty of stats and charts in this post — but stats are just stats until you start asking: Is that a lot or a little? Compared to what? When does it happen?
If you’ve ever wondered what your hometown weather is really like, read along as we dig into 2,900+ days of local rain data. You might find a few surprises. I did.
The Big Picture: 30 Feet in 8 Years
| Station: | PA-WS-22 |
| Date range: | Sept.1,2017 to Sept.9,2025 |
| Total days: | 2,931 |
| Rain Days: | 1,387 |
| Total rainfall: | 357" |
The headline in the table above is 357 inches of rain - that’s nearly 30 feet. It feels like a lot of rain across a span of 8 years. But is it? More on that shortly.
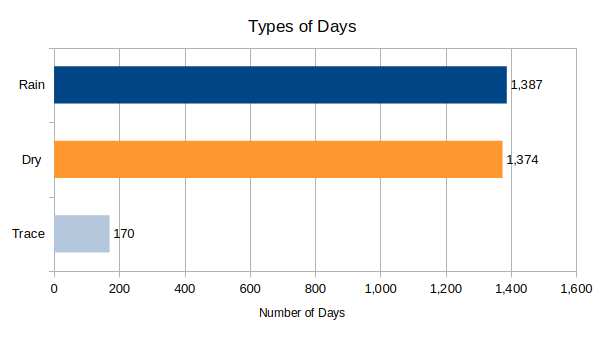
Another standout from the table, for me, is the 1,387 rain days. Weather observers define a rain day to be one where the observed amount of precipitation is 0.01" or greater. A dry day means no rain (0"), and a trace amount sits in between 0 and 0.01". You can see in the chart below that the number of rains days almost exactly equals the number of dry days. That finding really surprised me.
Year-by-Year: The Wet and the Dry
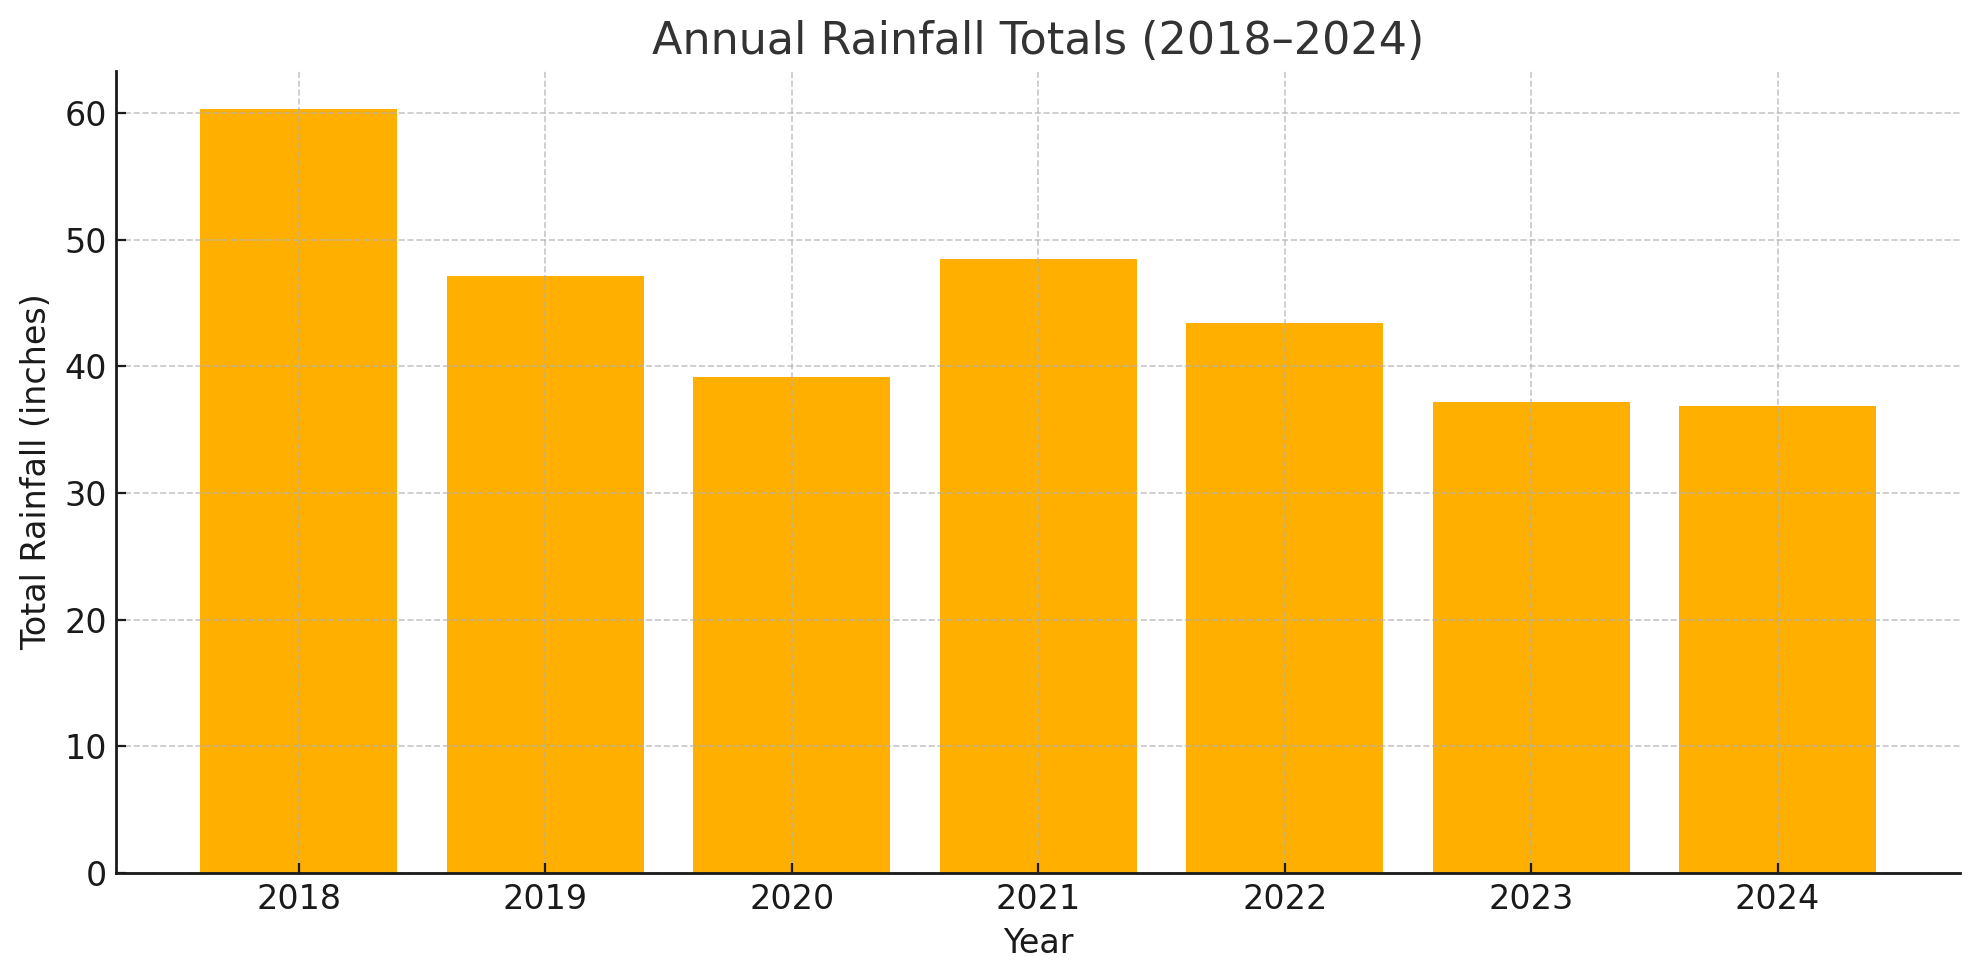
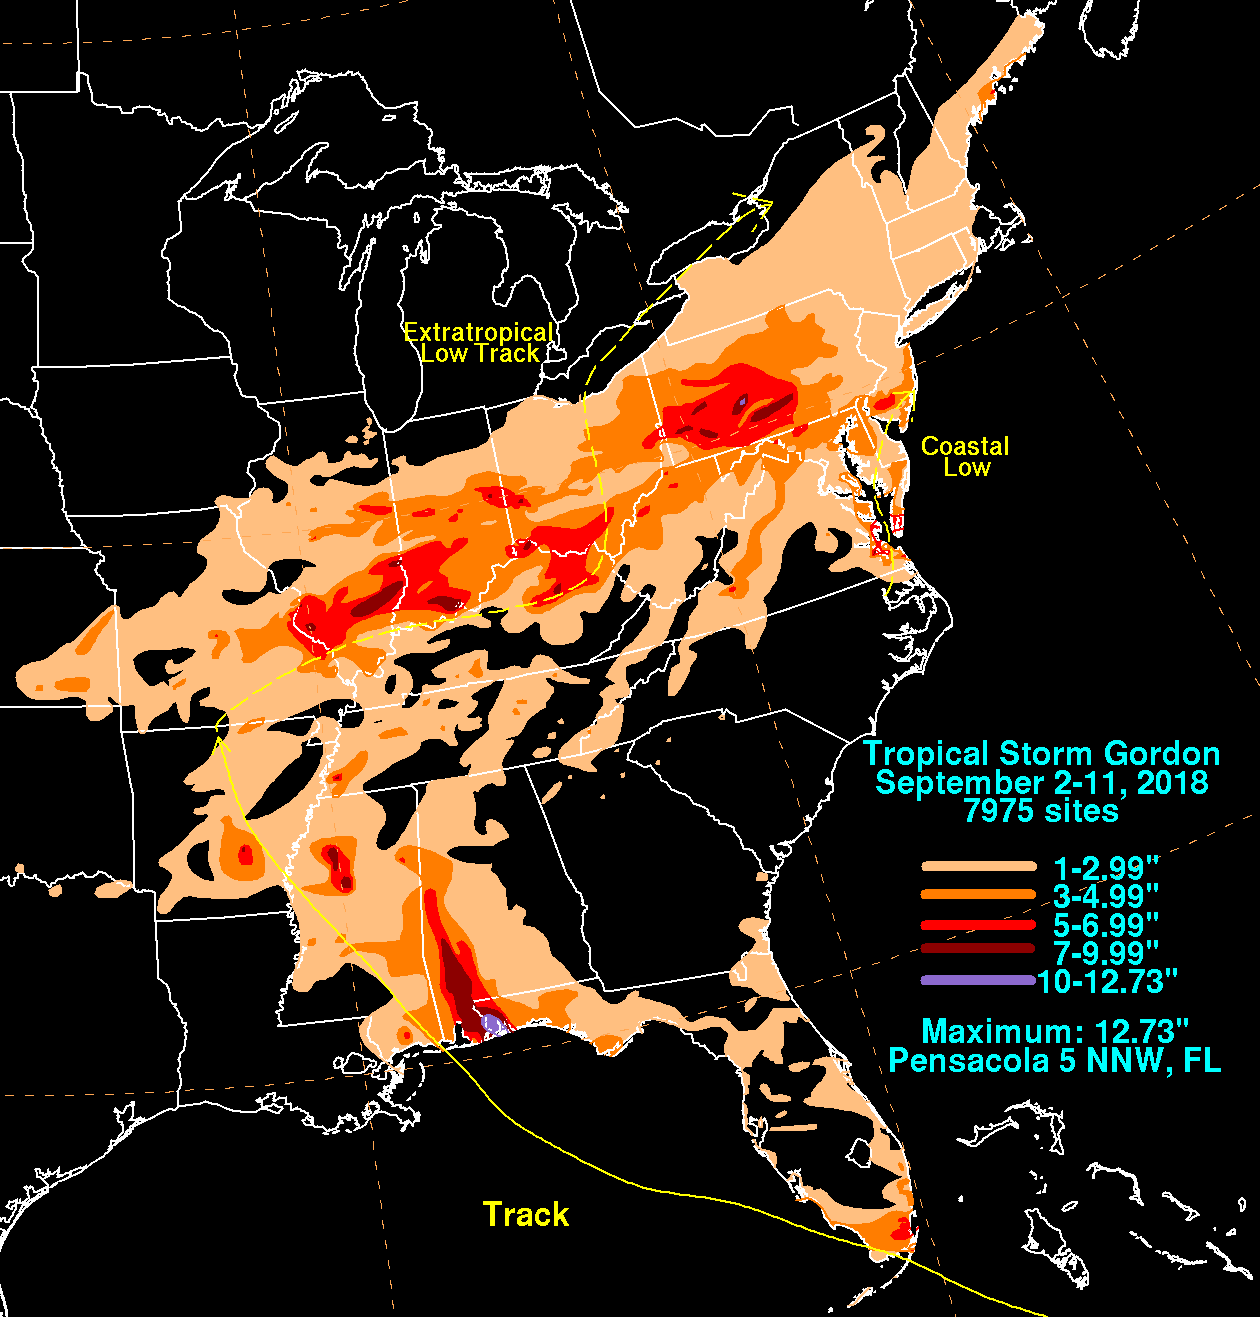
The chart above displays the amount of rainfall each (full) year at our location. We received 60" of rain in 2018 and only 37" in 2024. Tropical Storm Gordon played a big role in our wettest year, and we experienced a drought in the latter part of 2024, our driest year.
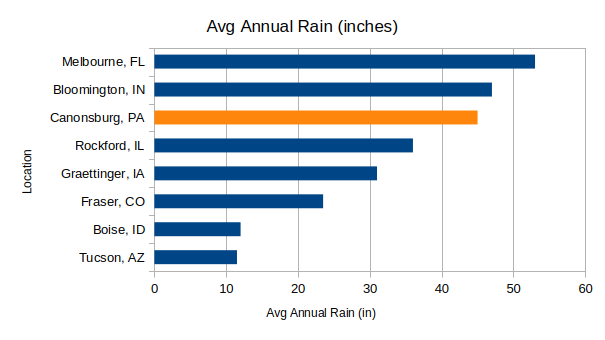
| Avg annual rainfall: | 45" |
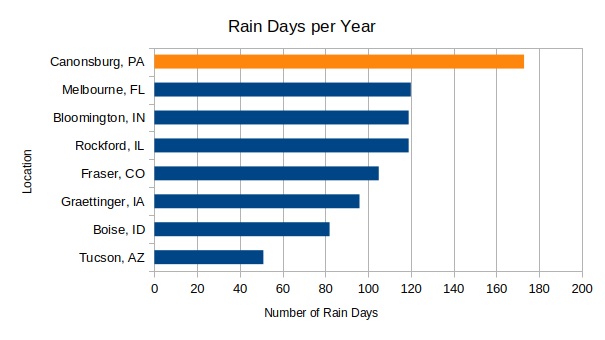
You might be thinking, “I need some context. Where does 45 inches of rain a year fall on the spectrum?” Rather than list rainfall at random major cities, I decided to do comparisons to locations of personal interest, places we like to visit to spend time with friends and family. In the chart below, you can see that our home in Canonsburg, PA, falls third within the group. Florida leads the pack with over 50 inches of rain each year, while the desert southwest of Arizona gets just a dozen inches annually.
| Avg annual rain days: | 173 |
The 50/50 split between rain days and dry days amounts to an average of 173 rain days each year. Again, you might wonder, “Is that a lot or a little?” Turns out, it’s a lot. As shown below, it’s 50 more rain days than our favorite spot in FL. Even though Melbourne gets 7-8 more inches of rain, annually, we get 7 more weeks of rain days.
Month-by-Month: Big Storms and Droughts
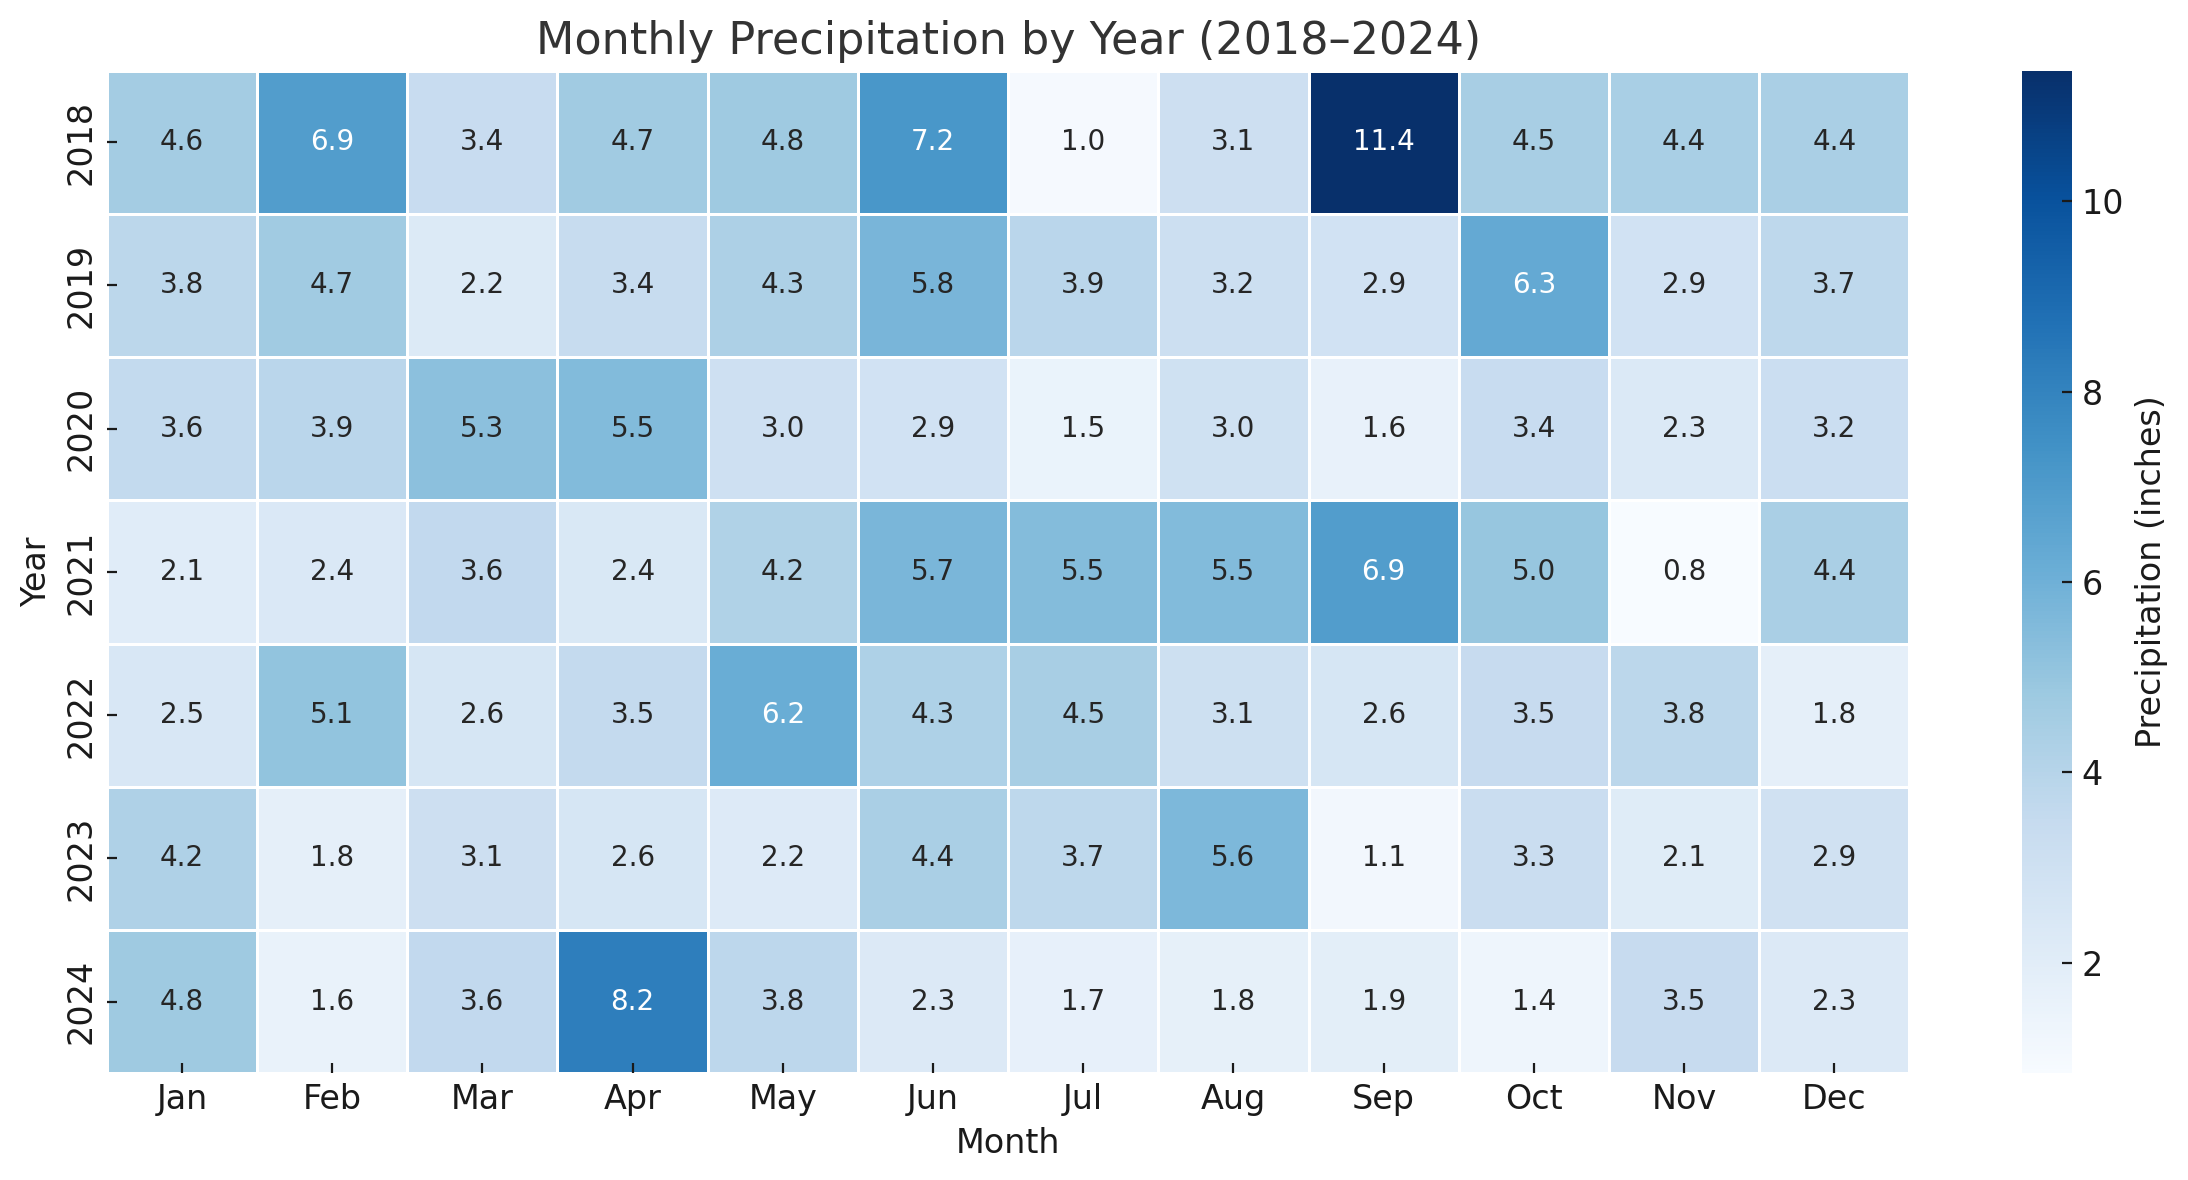
The rain table above provides a visual view by month and year. The darker the square, the more rain that fell during that month. Each square is labeled with the rainfall amount in inches.
As you can see, September 2018 was the wettest month of all, thanks largely to Tropical Storm Gordon (storm track and rain totals appear in the map below). We registered 11.37", or nearly a foot of rain, that month. 7.57" fell during the 7-day period, Sept. 6-12, 2018.
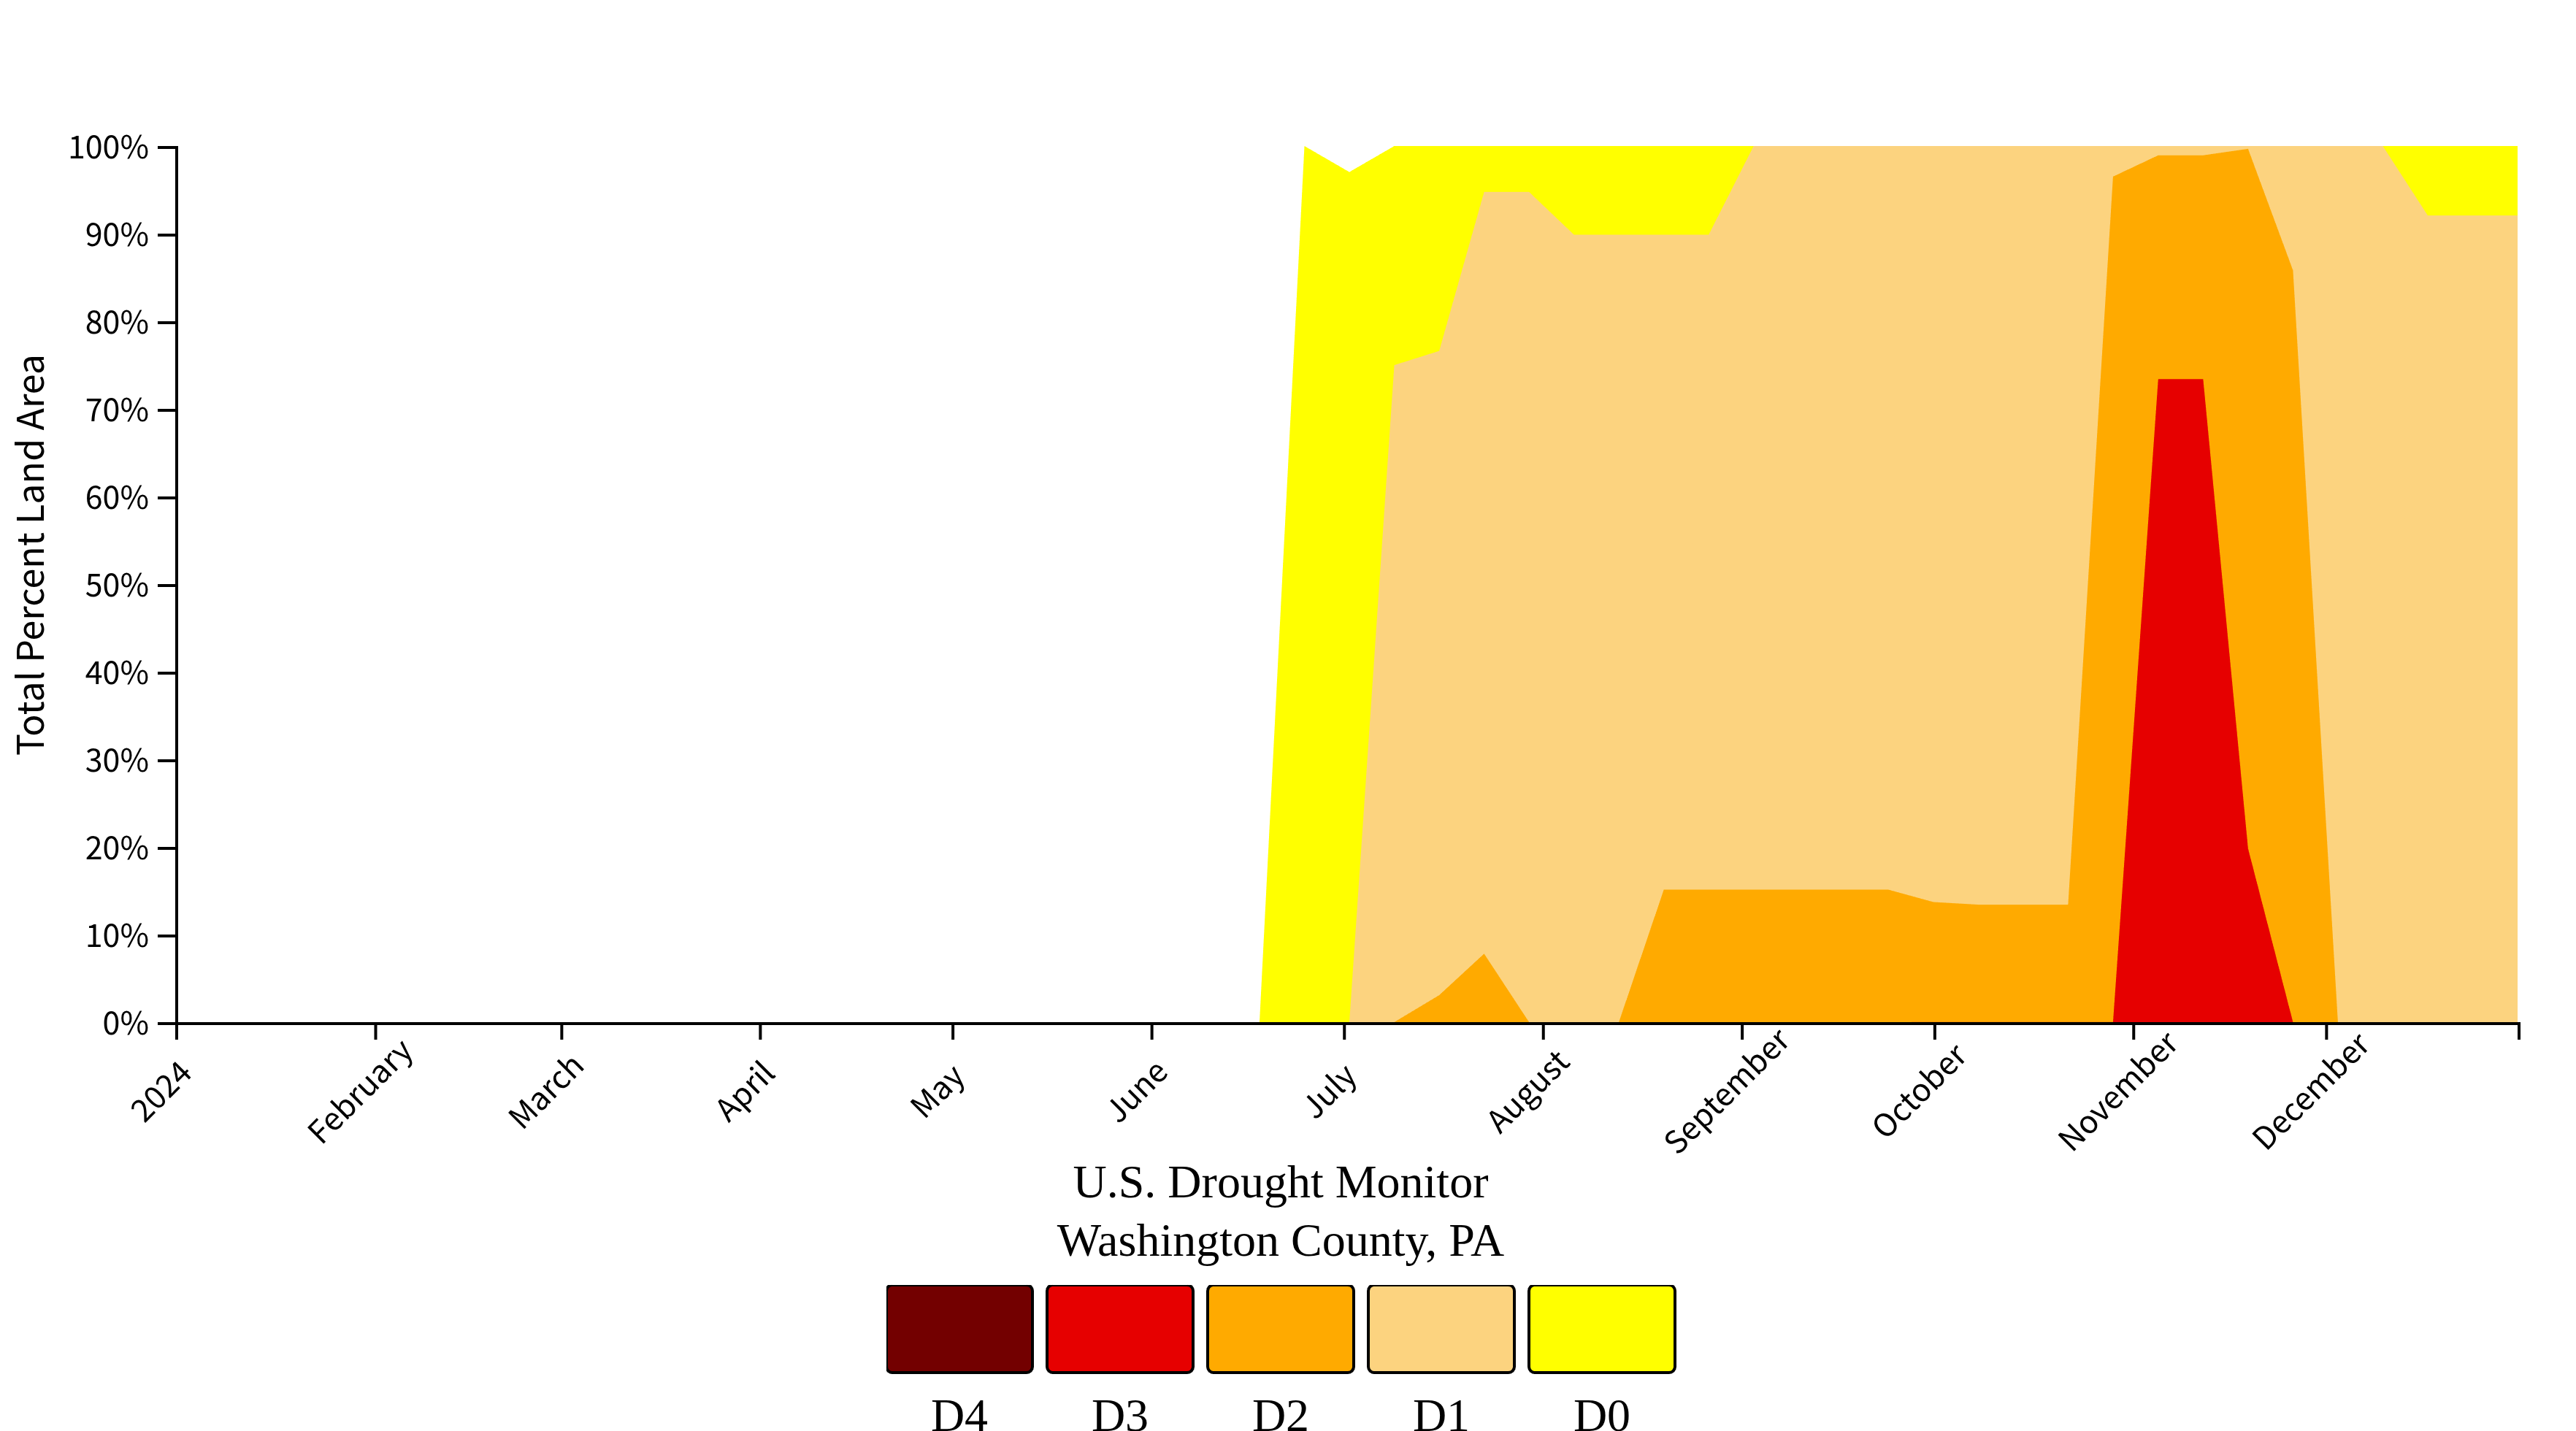
In stark contrast, the dry period having the greatest personal impact occurred July thru December, 2024, when we experienced a significant drought. I wrote about the drought previously (see The Day the Water Stopped), and if you’ve ever lost water to your home, you can appreciate the effects that dry weather can have on your life and lifestyle. The backdrop colors (yellow, tan, orange, red) in the visual below indicate progressively worse drought conditions (D0, D1, D2, D3, resp.) during that time for portions of Washington County, PA, where we live.
That’s the view across months, including the extremes. But what about individual rain days — how much usually falls when it rains?
Day-by-Day: The Typical and Not-So-Typical
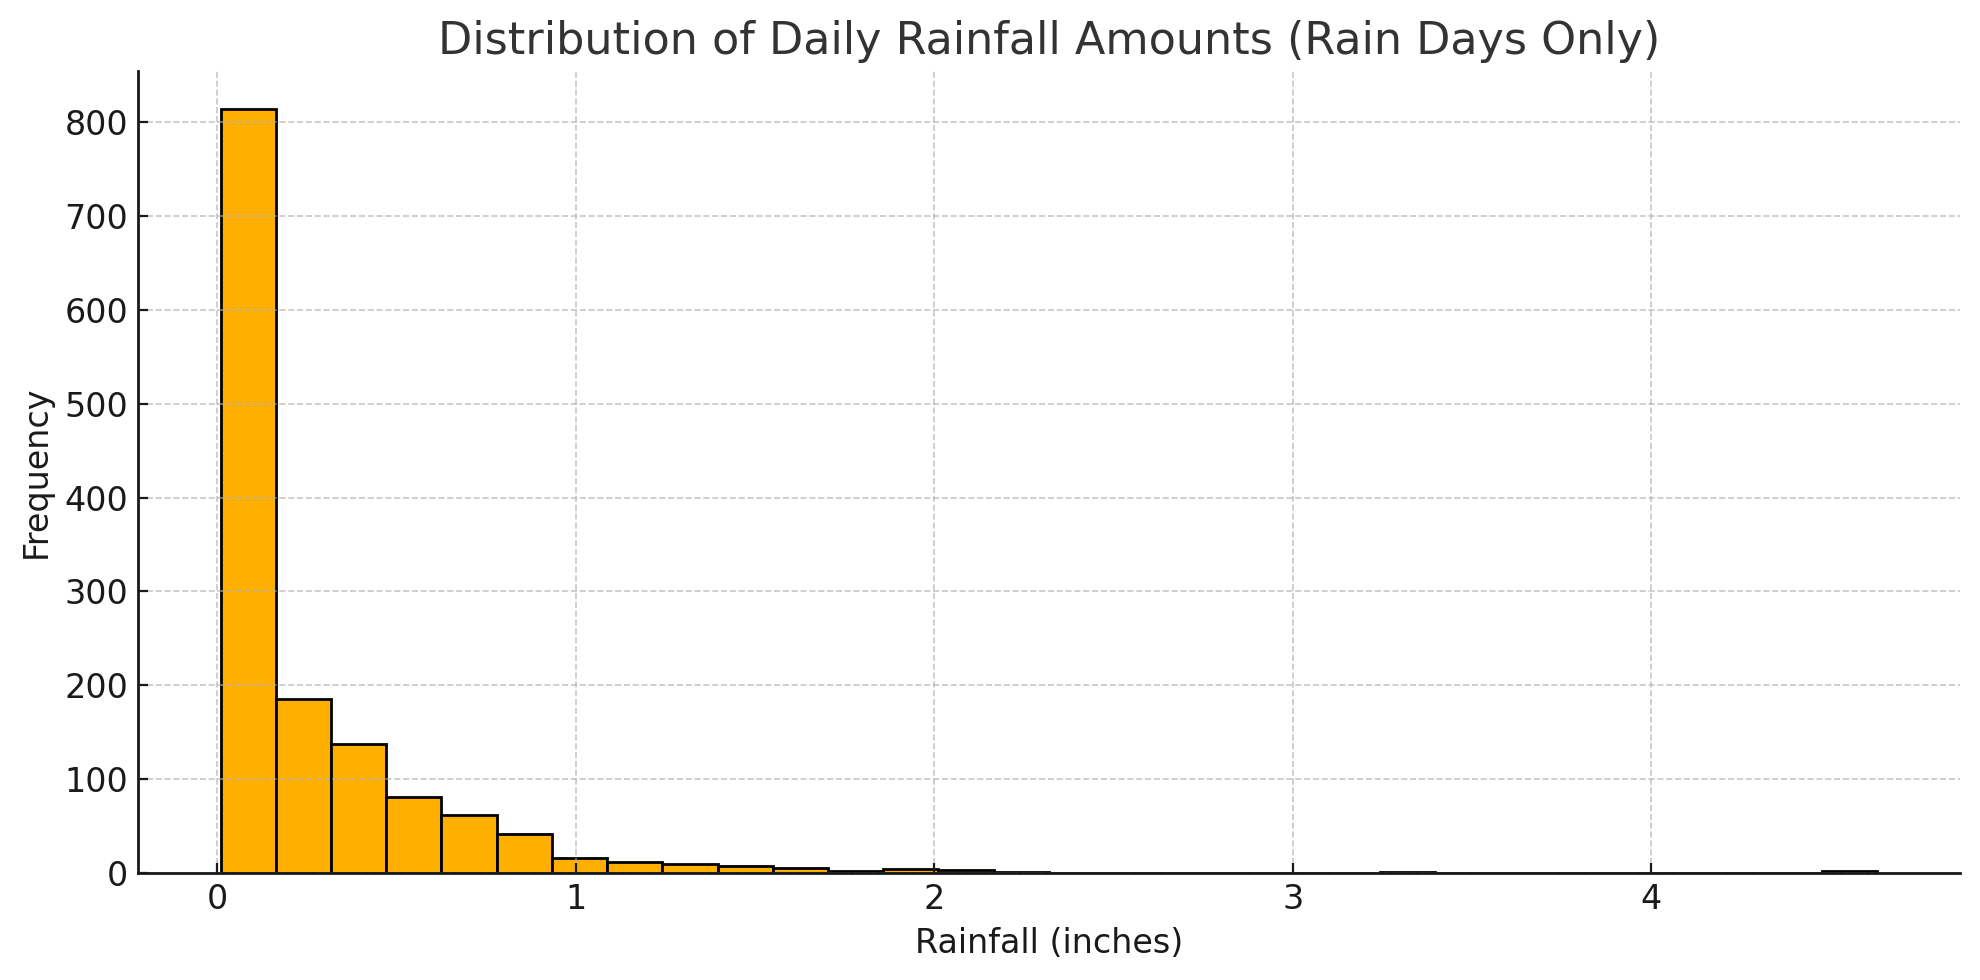
The histogram above displays the distribution of rainfall amounts on rain days. It’s not a bell curve. Rather, it’s a classic long-tail distribution: many days with small precipitation amounts, and very few days with large amounts. As you will notice in the table below, the daily average for rain days is 0.26", more than twice the median of 0.11". The average skews higher due to the long tail, and an average can be very misleading when the distribution isn’t bell-shaped.
| Daily median: | 0.11" |
| Daily average: | 0.26" |
The top five wettest days appear in the next table. Ironically, two dates in April 2024, our drought year, turn up in this table. The night of April 12, 2024 was especially memorable. We discovered water in our basement for the first time ever. So that was fun.
| 2021-09-01: | 4.63" |
| 2018-09-10: | 4.51" |
| 2024-04-12: | 3.33" |
| 2024-04-03: | 2.21" |
| 2017-11-06: | 2.11" |
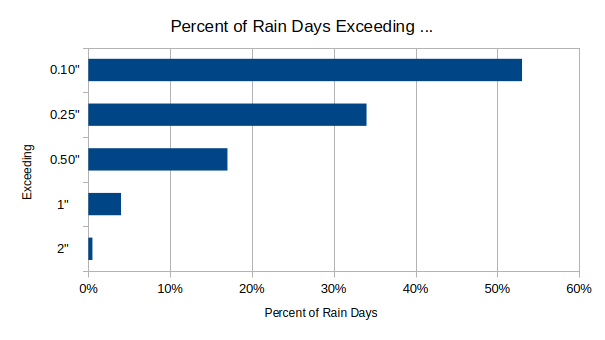
To put these daily numbers in perspective, I found it helpful to graph the percent of rain days exceeding common thresholds, as shown in the chart below. Just over half the time, rainfall here exceeds a tenth of an inch. Or conversely, almost half of our rain day events are less than a tenth of an inch. Only one-third exceed a quarter of an inch, just 1 in 6 exceed half an inch, and merely 1 in 25 rain days exceed an inch of precipitation. Rarest of the rare are days when we received more than 2" of rainfall. I’ve observed exactly 7 of those (0.5%) in 8 years, an average of roughly one per year.
Wrap-Up
After 8 years, the clouds have parted and some things are clear.
- We get more rain days than most places — almost half of our days, on average.
- Our typical rainfall is about a tenth of an inch, but extremes do happen. And they can make a big impact, like when Tropical Storm Gordon blew through our area in 2018.
- Drought entered the picture in 2024, and dry weather can be just as devastating, but more slowly and over a long period.
If you’re a fellow weather watcher — or just curious — I hope this post has given you a sense of what’s typical, what’s unusual, and what can happen in southwestern PA. Your mileage may vary.
And if you’re tracking your own rainfall or backyard weather, I’d love to hear what patterns you’ve noticed. Drop me an email — let’s compare notes (and totals).
References and Resources
- To access the data used in this article, check out graettinger-rain-data.csv.
- To learn more about CoCoRaHS and become an observer, visit CoCoRaHS.org.
- To get a groovy, and official, rain gauge, shop here.
- For rain and weather info for locations across the U.S., see weather.gov and bestplaces.net
- For drought information or to set up alerts for your area, see Drought.gov.