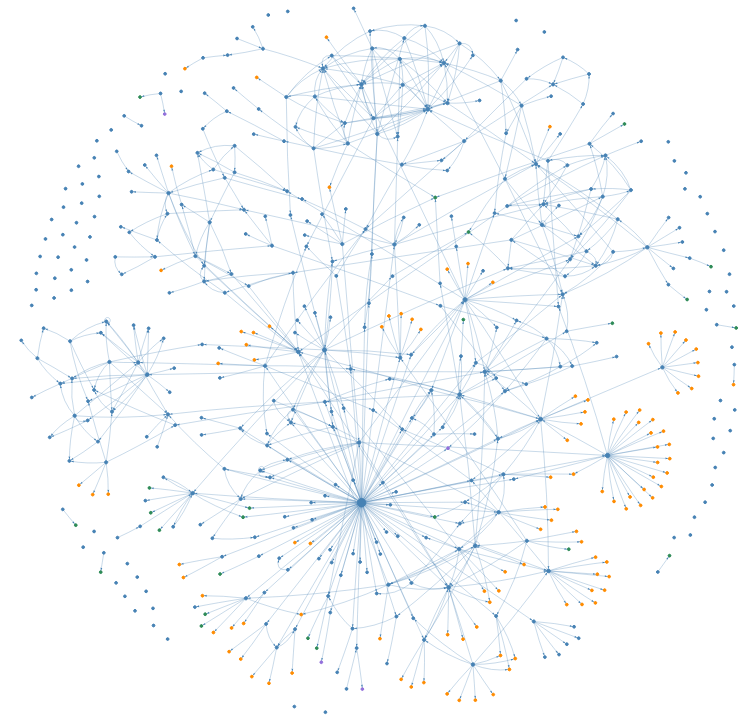
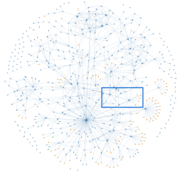
Now, I can SEE my digital mind – thanks to a Python script I wrote that turns my notes, etc. into an interactive “web graph”. That’s the image above, and I think it’s so COOL!
The graph is built from my web of notes – a collection of everything digital that I’ve written or created over the past nine months. For convenience, I’ll refer to ALL these different types of items as just notes. In the graph:
- Blue dots are text notes (Markdown documents).
- Orange dots are images (charts, photos, etc.).
- Other colors mark other types of files (PDF, Excel, Word, etc.) – but they’re few in number and hard to pick out in the image.
Each line is a link, a connection I make as I work. For example, when I write a post like this, I link to the images so that they appear with the text.
It feels like I’m exploring inside my own mind because the graph is interactive1: I can zoom, pan, hover and click. Zooming in makes note titles appear. Hovering reveals details like the number of links. Clicking on a note highlights its connections. I love it!
In the rest of this post, you’ll get a glimpse at my digital mind. And stay tuned for a future article where I’ll share my code – so you can explore your own.
Why It Matters
We all struggle to organize our digital worlds. This graph shows you how my ideas and artifacts actually connect: they form a web, not a hierarchy – in other words, not folders within folders within folders.
You need to learn to navigate so you can find and use your notes to do your “real” work.
Plus, it’s just cool.
The Big Picture
Like I did at first, you might be wondering, “How big is this thing?”
- Total notes: 525 over 9 months (about one-and-a-half notes each day)
- Text: 387 (74%)
- Images: 110 (21%)
- Other files: 28 (5%)
And, “How connected is everything?”
- Total links: 783
- Unconnected notes: 73 (14%)
- Average links per note: 1.5
The 1.5 link average includes the unconnected notes on the outskirts of the graph. The others are more densely linked than that. Still, one in seven don’t have a buddy! I suspect they’re unlikely to ever be found or used. Now that I know, I will work harder as I write to connect new notes to other notes in the web.
That’s a quick look at the big picture. Now, let’s dive deeper by focusing on some specific notes.
The Most-Connected Note: “Done”
close-up region
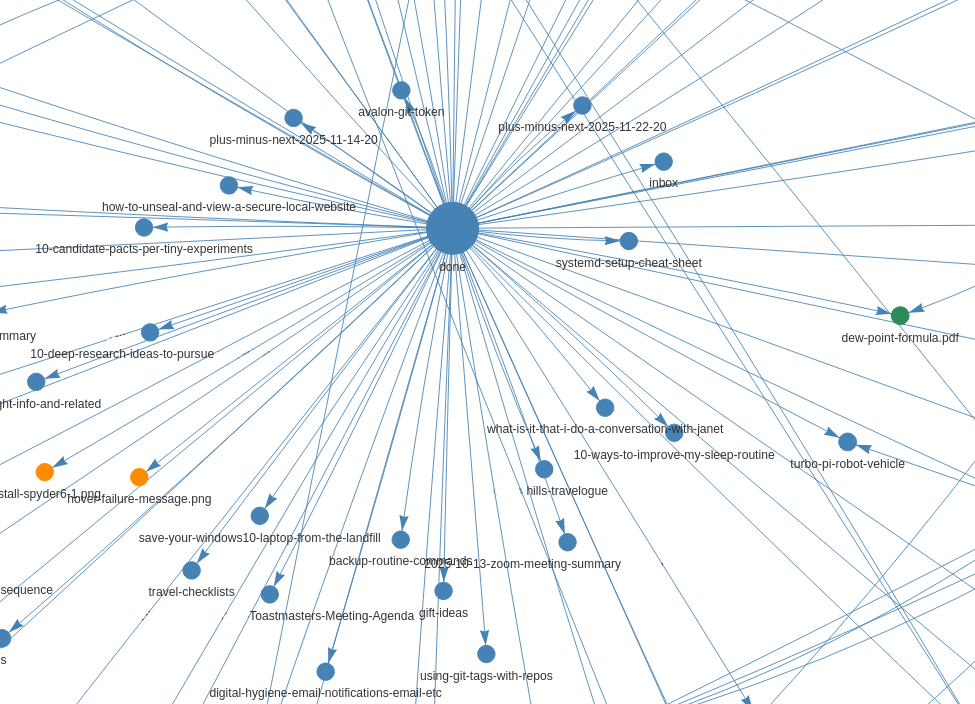
My done note looks like the hub of a wheel. It’s my daily log where I record what I’ve done and link out to new or updated notes. It’s also my most-connected note – with 94 links radiating out in all directions.
I find it to be an incredibly useful index into the other notes in my web. I can open it in my text editor2, search for a keyword or phrase, and quickly find links to other relevant notes. Without leaving the editor, I can open, read, and/or edit those related notes. That lets me rapidly reload context around any topic, whether I’m preparing for a Zoom call, revisiting an old project, or writing a new article.
An Article Note: “Have You Ever Seen the Rain”
close-up region
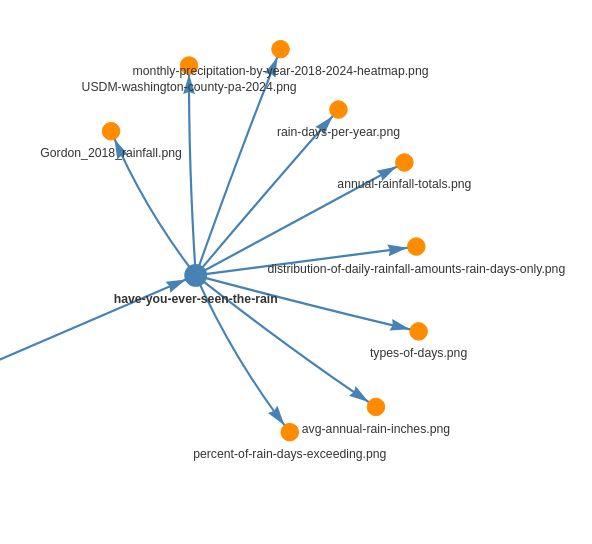
A text note, Have You Ever Seen the Rain (an article on this site), sits at the center of the close-up above. Nine outgoing links surround it, and they connect the text to the various images (orange) included in the article. Just one link3 points into this note.
What’s missing? No incoming connections from my research notes – because I intended this as a standalone piece. And the images? They’re not reused anywhere – that’s an unmet opportunity.
A Project Note: “Using PyVis to Visualize My Web of Notes”
close-up region
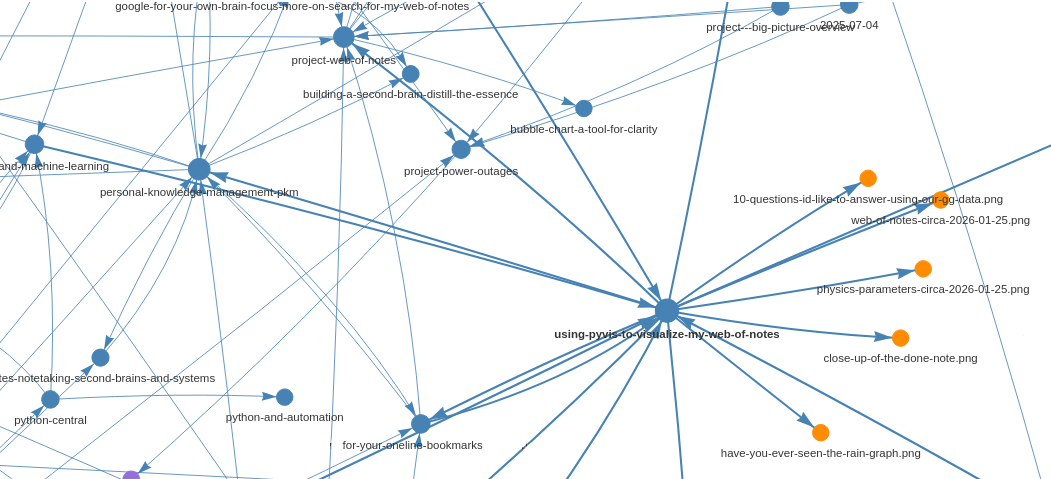
This close-up focuses on the note, “Using PyVis to Visualize My Web of Notes”, which is the basis for this article. Six links are incoming, and twelve are outgoing. Among the outgoing, you can see connections to (orange) images/charts and to (blue) text notes on a handful of related topics, such as: “Personal Knowledge Management (PKM)”, “Project Web of Notes”, and “For Your Online Bookmarks”. Who’d a thunk it!
Together, these notes form a tight knowledge cluster - and you can see similar ones all over the graph. That’s encouraging!
Wrap-Up
Curious about creating and using a system for your own notes? Do NOT start with code — start with a purpose. Next post, I’ll share the principles that guide my web of notes, refined over 20+ years. They just might surprise you.