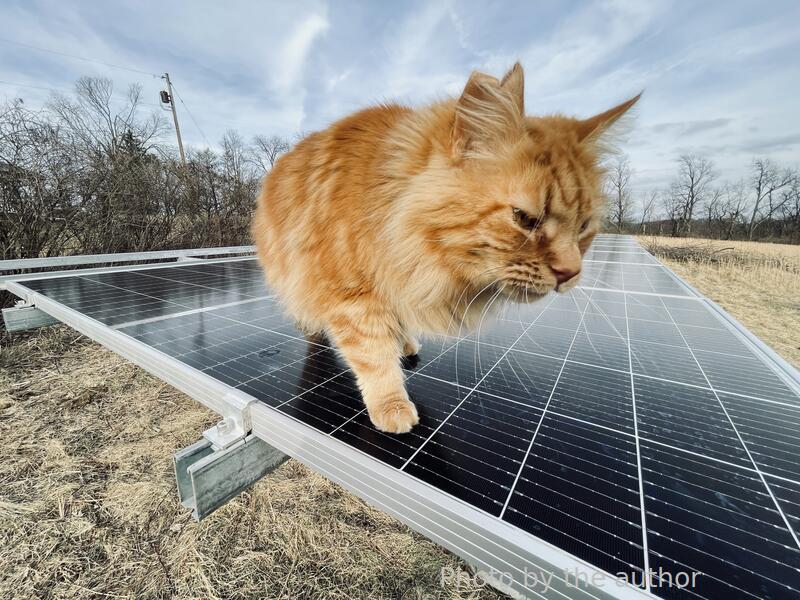
Tiki, our cat, inspecting the solar panels during installation in 2022.
Four years ago, we flipped the switch on our solar panels with much hope and anticipation… and a bundle of nerves. Had we really thought this through? Would the panels work as advertised?
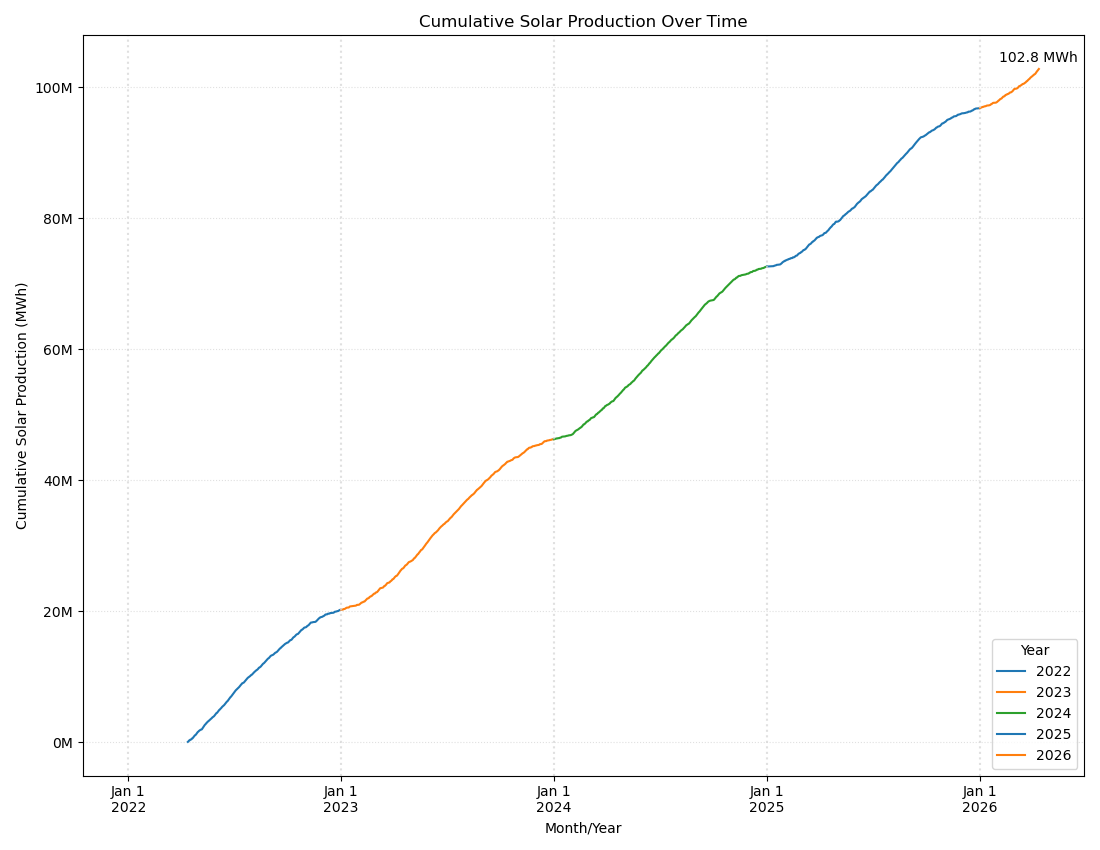
This week, we crossed a big milestone sooner than we ever expected:
100 megawatt-hours of electricity generated — right here in cloudy, rainy, western Pennsylvania.
We celebrated this high-water mark with great joy. Now, I really want to understand it better, and maybe you do, too.
Why It Matters: 100 MWh in 4 Years
| Date range: | Apr.13,2022 thru Apr.12,2026 |
| Total days: | 1,461 |
| Total production (MWh): | 102.8 |
Here’s the headline: 102.8 MWh since start-up. During that time, we:
- Powered our all-electric house
- Never paid an electric bill.
- Built up a surplus – enough to drive an electric vehicle for free.
Let’s put that number into perspective in a few different ways. One hundred MWh of solar energy equates to:
- Taking 21 cars off the road for a year
- Planting 8,000 trees
- Saving $15,000 on electricity
When we installed the solar panels, electricity cost us 11.4 cents per kilowatt hour. Now, it costs 17.2 cents – a 50% increase in four years. With every kilowatt-hour we produce, we’re holding the line against future price increases.
Year-by-Year: Surprising Consistency
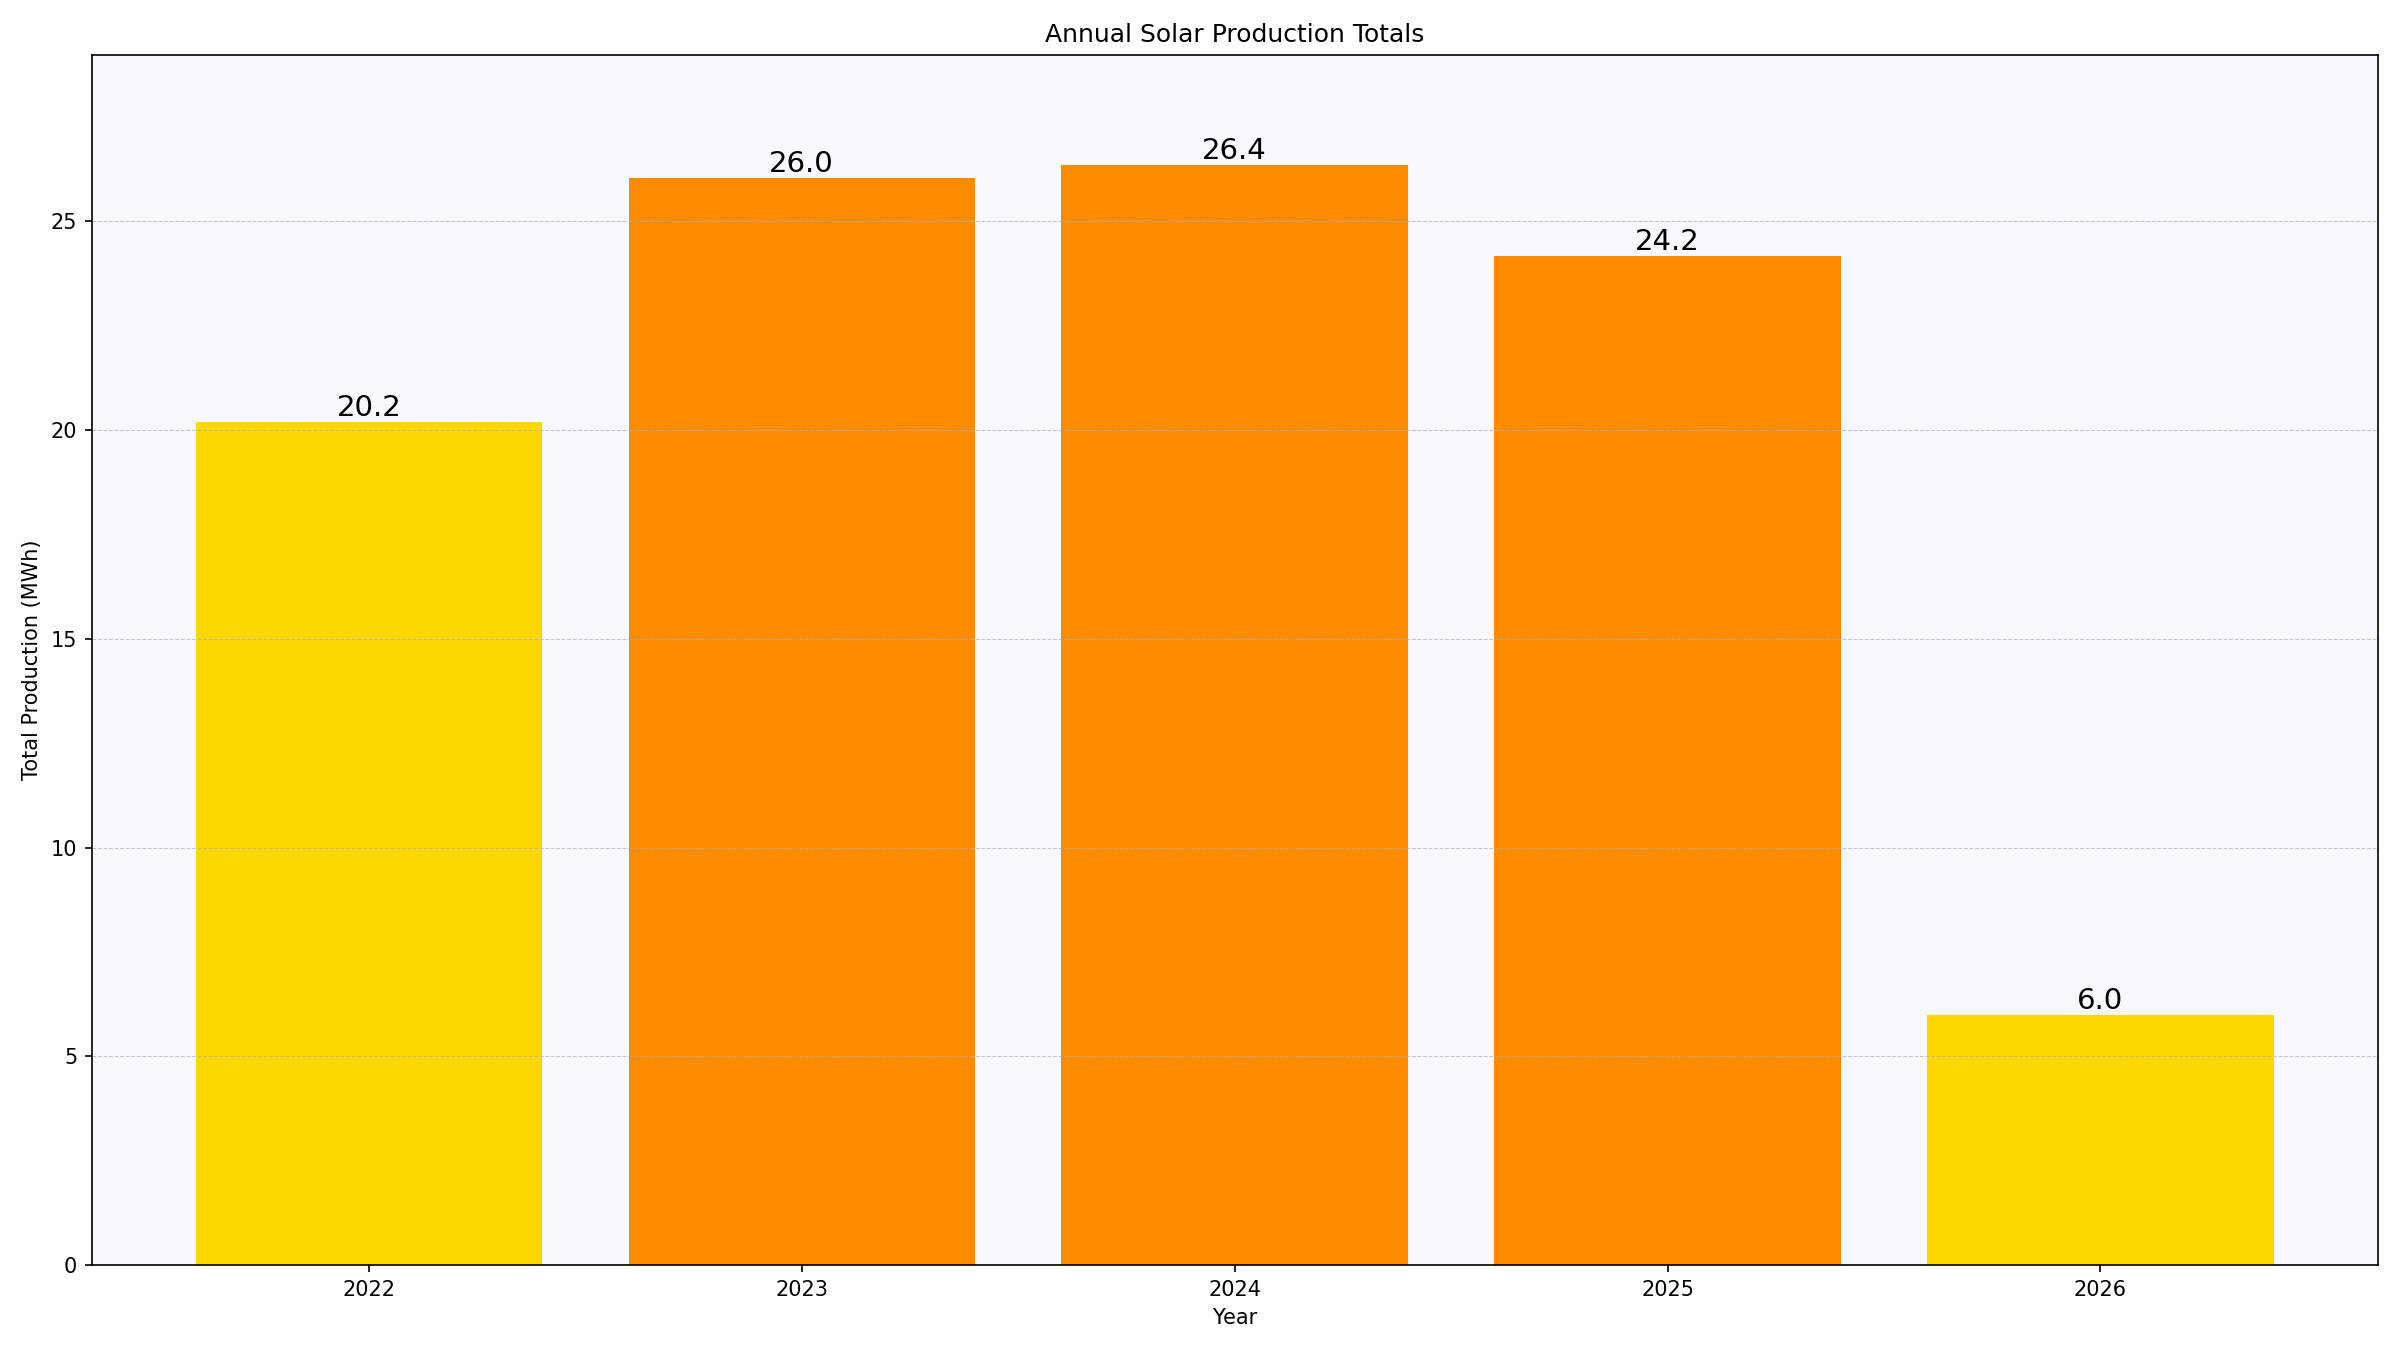
Total solar production by year at our location. Orange bars denote full years while yellow bars indicate partial years.
We produced 26.4 MWh in 2024 (a drought year) and just 24.2 in 2025 (a year when 16 panels, one of our three arrays, went down for almost a month, due to a technical glitch). All in all, though, I feel like our yearly production has been pretty consistent, which surprised me since our weather can be so variable.
| Avg annual production (MWh): | 25.7 |
You might be thinking,
“Compared to what? Where does a yearly average of 25.7 MWh fall on the spectrum?”
The PVWatts Calculator can provide some insight. I entered parameters for our system and location1, and it calculated an estimate of 25.9 MWh/year – almost exactly our average annual production!
Applying those same parameters for a handful of other locations of personal interest2, I used PVWatts to calculate the estimates shown in the chart below. You can see that our home in Canonsburg, PA, falls last within the group. Tucson, AZ sits on top with an estimated 38.1 MWh/year, nearly 50% more than our location. We get a lot of cloudy, rainy days. And yet, we can still produce all the power we need.
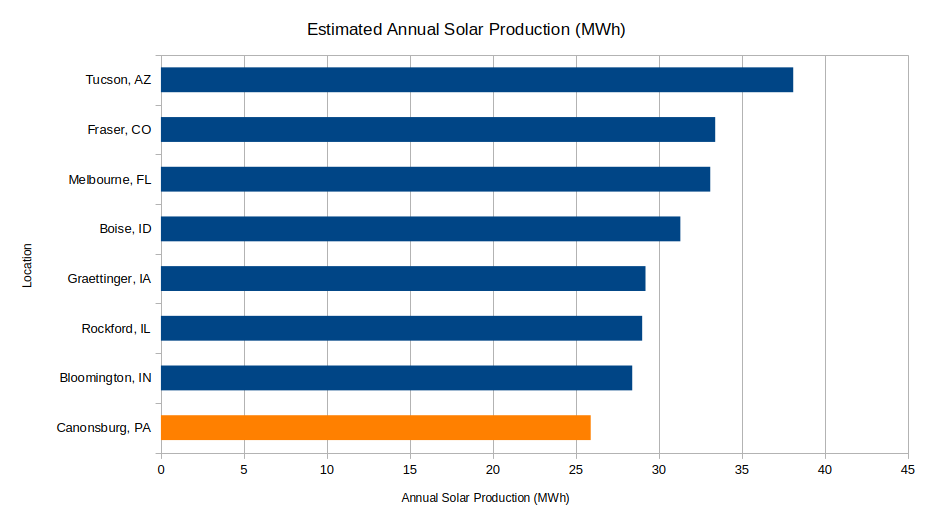
Estimated yearly solar production at various locations around the U.S. Our home in Canonsburg, shown in orange, trails the pack.
Month-by-Month: Almost Anything Can Happen
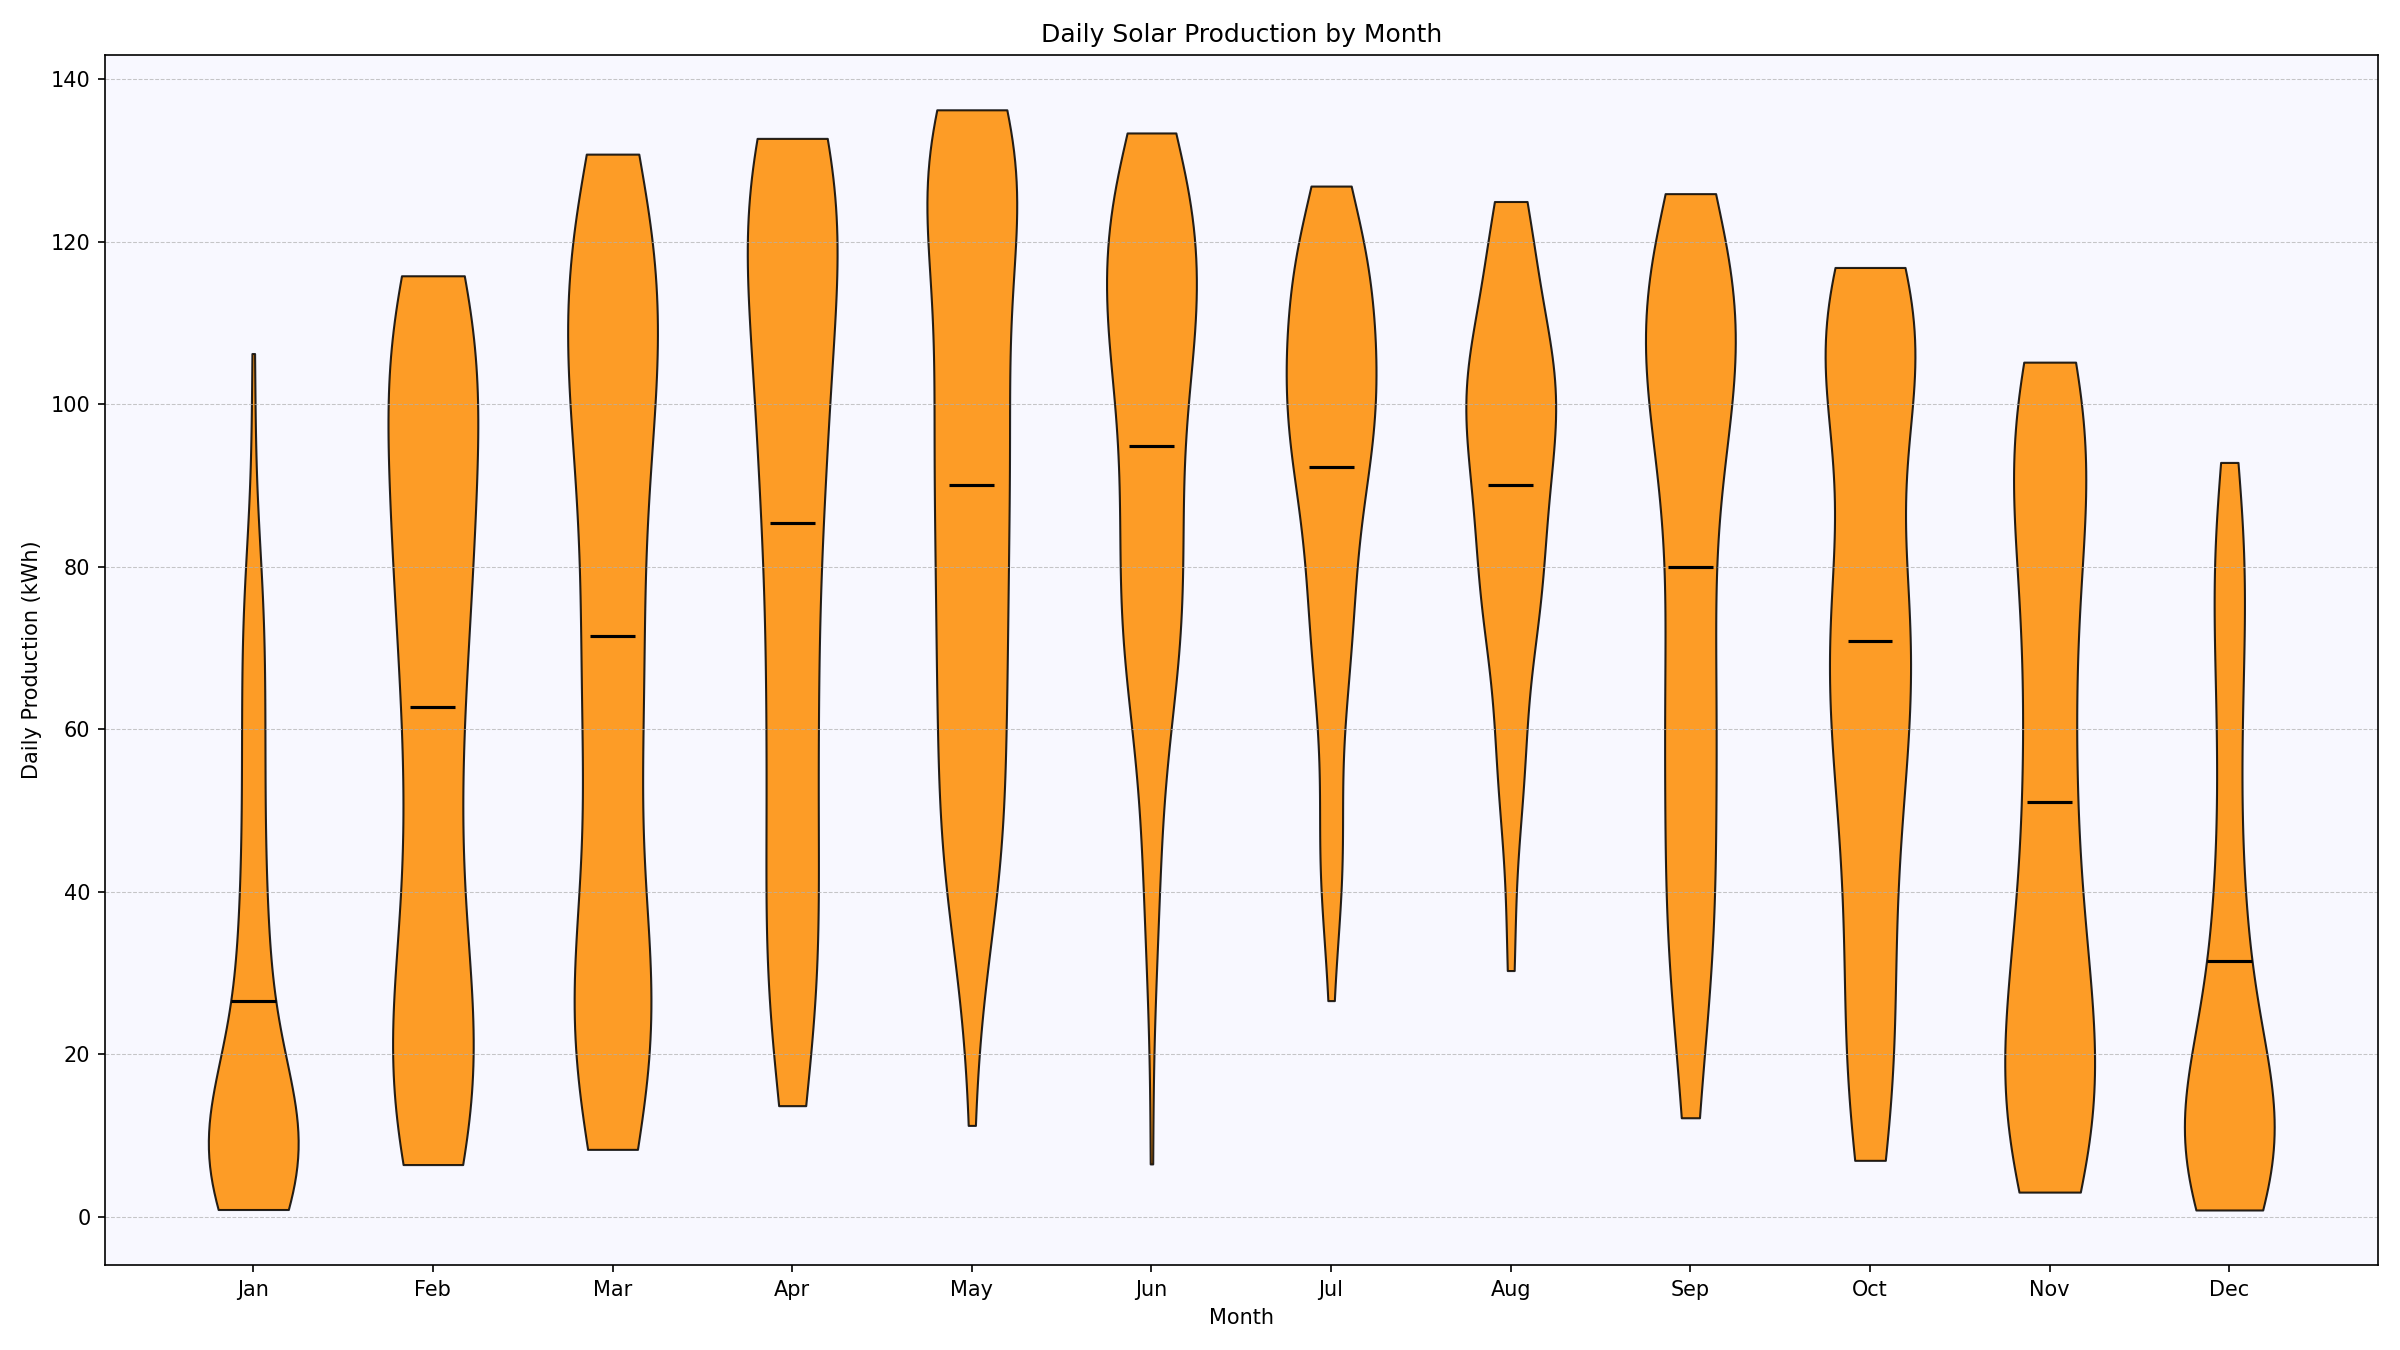
“Violin plot” showing the distribution of daily solar production by month. Thicker areas indicate more days than thinner areas. The average for each month appears as a short, dark line.
Our average monthly production follows a smooth curve, as shown by the short dark lines in the plot above. Starting from a low in January, the average jumps significantly in February, then rises steadily to a peak in June. From there, average production falls off to the year-end low in December. You might be thinking, “No surprises there”.
But what I do find quite surprising are the monthly highs, lows and shapes. Take January, for instance: our panels produce less than 25 kWh for the bulk of days – note the bulge in the violin shape. The lows are very low, just 1-2 kWh, typically days when a heavy snow has piled on the panels. But we also see days in January when production exceeds 100 kWh. That’s 4 times the average!
Conversely, consider June where the average is 95 kWh/day. The high stretches above 130, but the low falls below 10. That spread is more than 120 kWh!
To me, these monthly distributions suggest that almost anything can happen on any given day: we can produce 106 kWh in January or only 6 kWh in June.
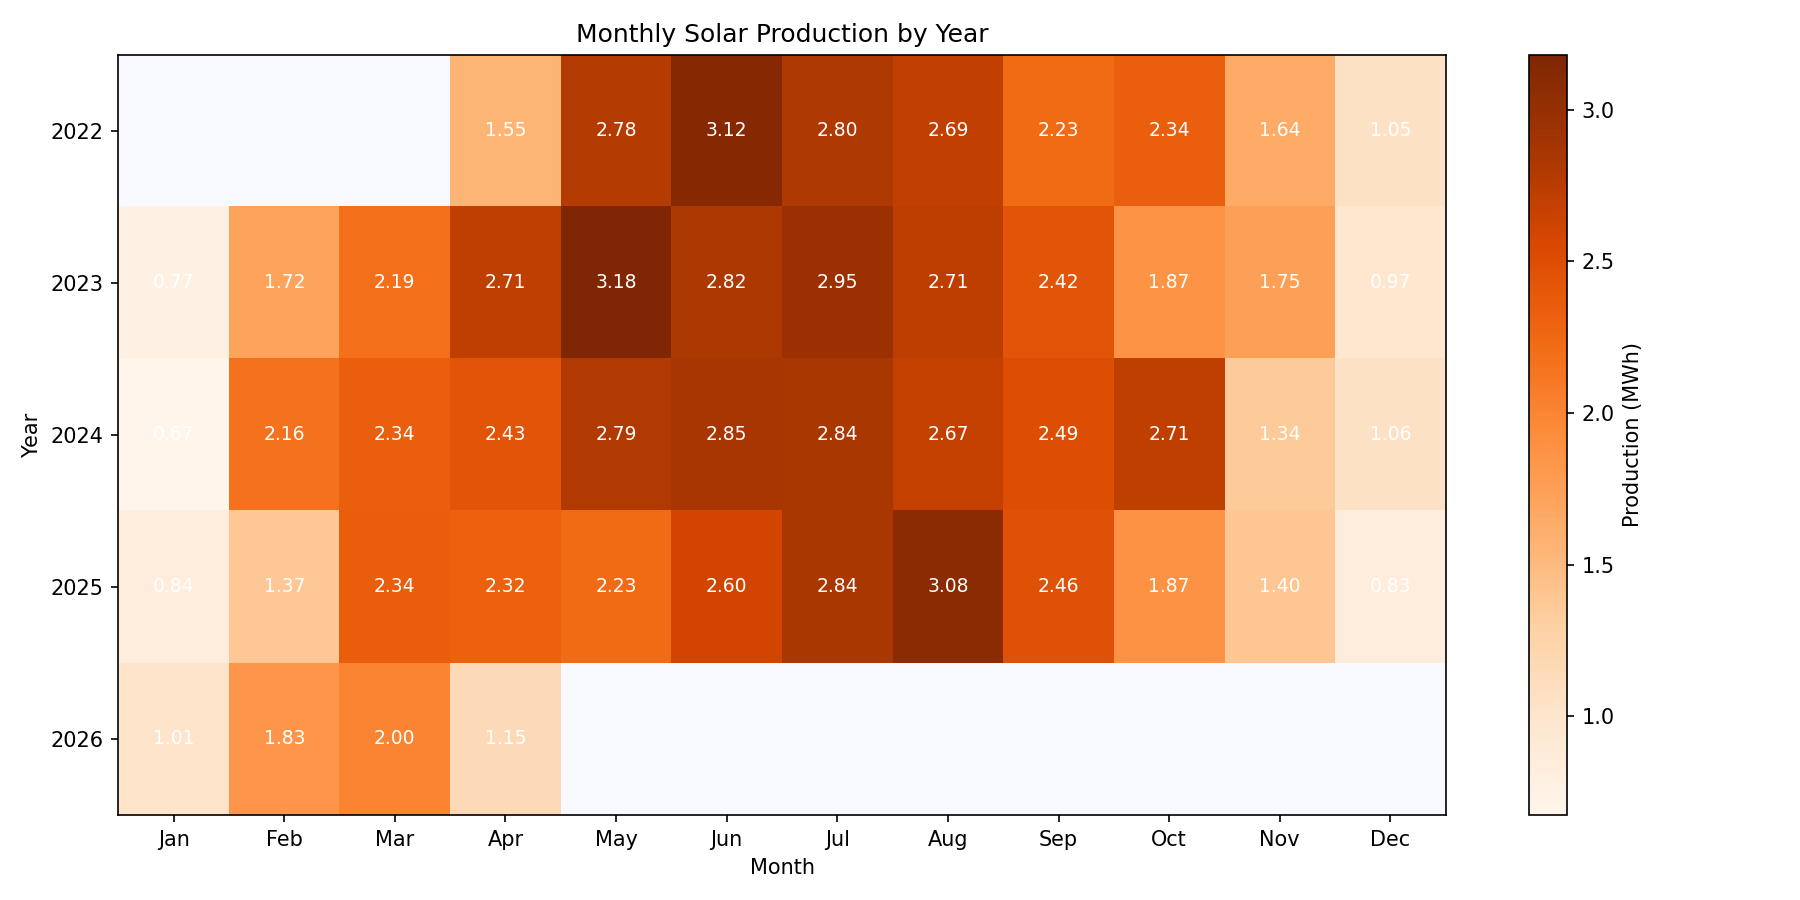
Heatmap of solar production by month and year. The darker the square, the more solar production during that month. Each square is labeled with MWh produced.
You can see in the heatmap above that May 2023 was the sunniest month of all. It registered 3.18 MWh, or nearly 4x the 0.77 MWh produced in January of that same year.
The 0.67 MWh produced in January, 2024, represents the low point over the four-year span. Clusters of low production in winter and high production in summer really pop out in this view.
Day-by-Day: It’s Just Not Normal
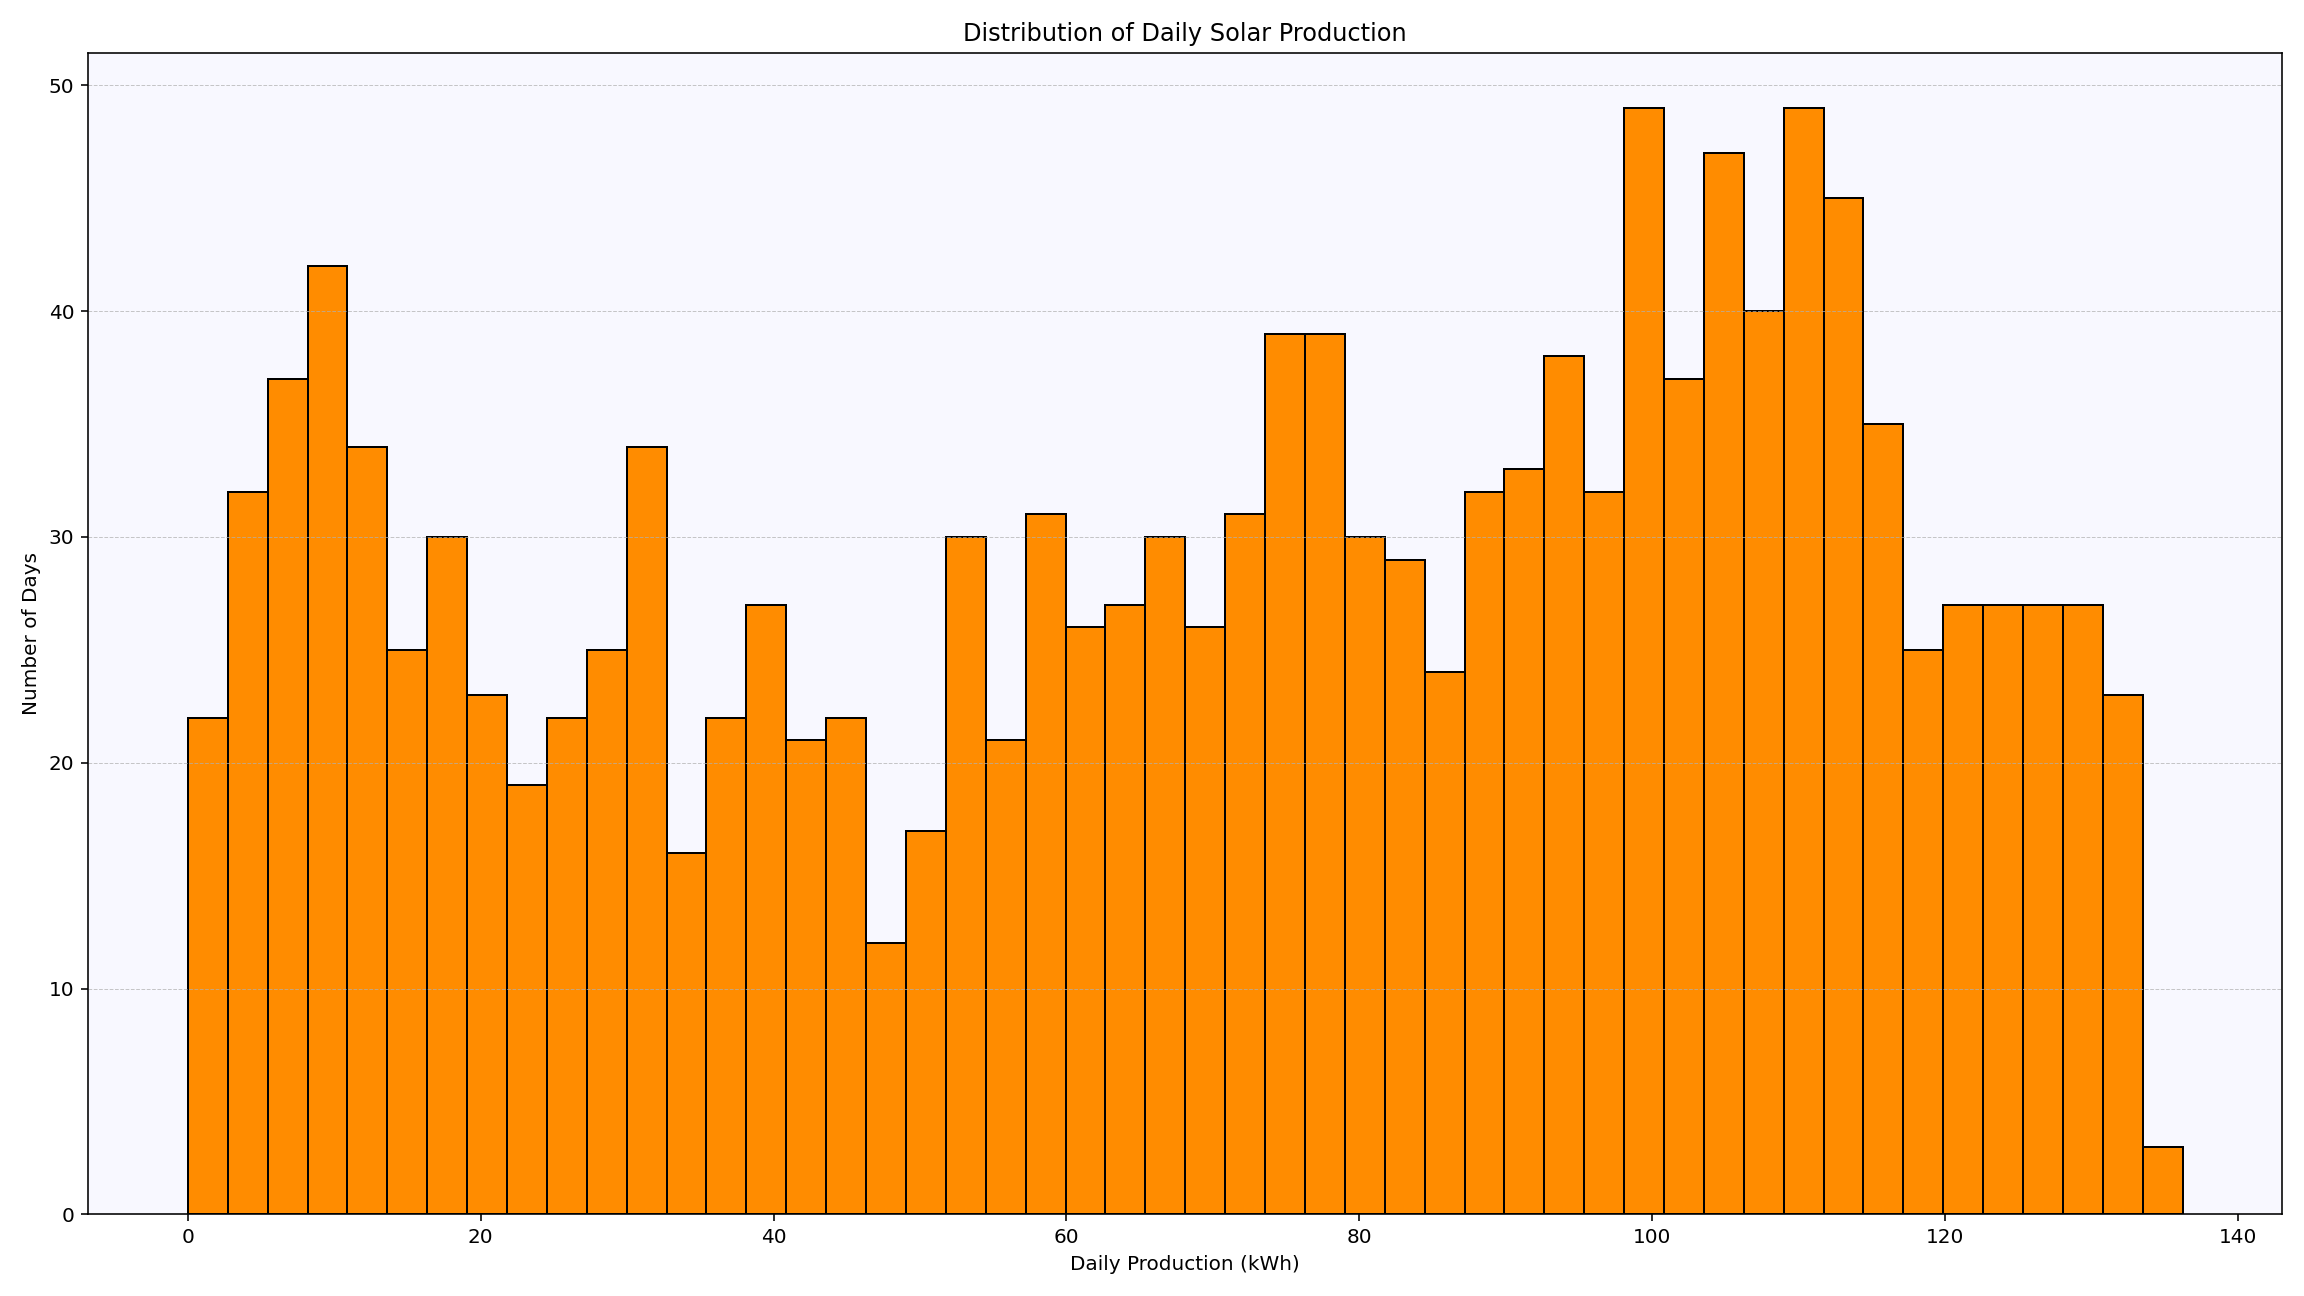
The distribution of daily solar production amounts.
The daily distribution is NOT a “normal” bell curve. It’s not uniform (flat). It’s not long-tailed on either end. It’s more like a lumpy blend of all the seasons.
| Daily median (kWh): | 75.44 |
| Daily average (kWh): | 70.35 |
My takeaway: the median represents the middle value, of course, but you really need to pay attention to the wide spread of values. In my area, if you want to charge an electric vehicle, run a heat pump, or live off-grid, make plans using the monthly average, not the yearly average – and still expect a lot of variation.
Wrap-Up
Four years into our solar adventure, the numbers tell me a lot about how much power we’ve produced and when we produced the most/least. But perhaps more importantly, the experience has really informed how I think about solar energy. For us, solar is:
- Seasonal
- Highly variable day-to-day
- Ample – even here in Pittsburgh
If you’re on the fence about solar, my advice is simply this:
- Try the PVWatts Calculator. Type in your location and use my parameters1, or guess-timate your own.
- Compare your annual potential versus your usage based on your electric bill.
You might be surprised by what you find. Remember, our home in Canonsburg, PA (near Pittsburgh) is probably a floor, not a ceiling, on what solar can do at your home. It works for us. It might work for you, too.
To Go Deeper
See also:
- Four Questions Our Solar Charts Help Us Answer
- Is Our Solar Surplus Big Enough to Drive an EV for Free?
The parameters I used with the PVWatts Calculator were: DC System Size: 21.1 kW, Tilt (deg): 30, and for everything else, I used the default values. ↩︎ ↩︎
I used these same locations previously in my article, Have You Ever Seen the Rain ↩︎